Greenhouse gas emission pricing, tax cuts and economic growth in Australia

One of the most studied topics in the field of economics is the impact of a per-unit tax when it is applied to one product and not to others.  It is well understood that such a tax increases the costs of production for the taxed product thereby leading to an increase in its price.  This discourages demand for the taxed product while encouraging the consumption of alternatives.

Through this mechanism, tobacco taxation is intended to reduce the incidence of smoking related disease while generating government revenue, thereby relieving pressure on the public health system and the public purse.  The instrumentality of a per-unit tobacco tax, therefore, is to shift some of the public health bill towards the users of tobacco and away from the average non-smoking taxpayer.  It is applied to something we all want less of, a tax on a bad rather than a good.

In this way, a tax on tobacco that captures its associated health costs is believed to be an economically efficient tax.

In general, taxes in Australia are not efficient in design.  This sentiment would, no doubt, be agreed to by most if not all Australian economists and likely by politicians right across the spectrum.

Most of our taxes are not applied to activities that we would seek to discourage but rather are placed on factors of production – such as labour, capital, land, materials and energy – the employment of which is normally encouraged in the pursuit of economic growth.  This is inefficient because in the same way that a tax on tobacco discourages its use, for any given level of final demand a tax on a productive factor reduces a business’ incentive to employ it.

Viewing human caused greenhouse gas (GHG) emissions as a counter-productive bad leads to consideration of a pricing policy similar to that applied to tobacco products.  However, unlike tobacco, human caused GHG emissions are always bundled up with some factor of production, in particular fossil fuel based energy.  The Federal Government’s proposal to put a price on GHG emissions will raise the purchase price of more polluting fossil energy relative to less polluting energy alternatives.

So what does this mean for economic growth?

Given that this policy will discourage the use of currently low priced factors of production, brown coal for example, at first glance it may appear to represent a drag on employment.  However, a GHG emission price will generate substantial government revenue.  Such revenue will be directed towards cutting inefficient taxes on low polluting factors of production as a form of compensation for the higher product prices that are likely to result from the policy.  In principle, revenue generated by taxing counter-productive bads can be used to lessen the tax burden on highly productive business inputs such as labour and capital.

All else being equal, tax cuts on labour and capital will increase wages and profits.  Because labour and capital are factors of production, reductions in their taxation will encourage their greater employment.  In isolation, this will have a positive impact on economic growth.

Labour and capital are substitutes for carbon and hydrocarbon based fuels.  Less GHG intensive electricity generation, for example, is often attainable through the application of marginally more expensive capital equipment.  Similarly, more labour is employed per unit of energy delivered by renewable energy and energy efficiency technologies when compared to fossil fuel based technologies (Wei et al., 2010).  In this way, lowering the tax rate on labour and capital will assist in the transition to lower emission systems of production.

A price on GHG emissions will provide not only a disincentive to invest in current high emission technologies but will also incentivise the application of new low emission technologies.  Nobel laureate John Hicks (1932) suggested that an increase in the price of one factor of production compared to another would drive innovation aimed at saving the now more expensive input.  Empirical evidence on the correlation between energy prices and energy productivity has since supported this hypothesis (e.g. Newell et al., 1999).

Another Nobel Laureate, Robert Solow (1957), found that factor-saving technical change accounted for 87.5 per cent of economic growth per unit of labour in the United States over the period 1909 to 1949.  More recent contributions by Lucus (1988), also a Nobel Prize winner, and Romer (1986) placed even greater emphasis on factor productivity as a cause of economic growth.

Kenneth Arrow (1962), yet another Nobel Prize winner, highlighted the importance of learning-by- doing in driving technical change and, by implication, economic growth.  Unit cost reductions appear to be more rapid in the early stages of a technology’s deployment, suggesting that from this time forward capital expenditures associated with modern low emission energy transformation processes are likely to become cheaper far more rapidly than the long established high emission technologies, provided they are encouraged to enter the market to enable such learning to occur.  Arrow (2007, p .5) suggests that “Since energy-saving reduces energy costs…” we should not be surprised if the gross effect of GHG mitigation policy over the coming decades will be to promote economic growth rather than to suppress it.

All of this suggests that economic growth concerns provide little or no justification to oppose a policy of tax cuts funded by a GHG emission price.  All the evidence suggests this is a low cost means to the bipartisan end of precautionary GHG mitigation.  Even if one were tenacious in a belief that the mainstream climate science is seriously flawed (i.e. that the climate change is minor or that it is not strongly influenced by economic activity) a rejection of the low cost domestic policy response described above would not follow naturally from such a belief, unless one were to also reject the mainstream economic science.  Putting a tax on something we don’t want and cutting taxes on things we do is probably good economic policy.

References

Arrow, K. J. (1962). The Economic implications of learning by doing. The Review of Economic Studies, 29(3), 155-173.

Arrow, K. J. (2007). Global climate change: A challenge to policy. The Economists’ Voice, 4(3), Article 2, 1-5.

Hicks, J. R. (1932). The Theory of Wages, London: Macmillan.

Lucas, R. E. (1988). On the mechanics of economic development. Journal of Monetary Economics, 22(1), 3–42.

Newell, R. G., Jaffe, A. B., & Stavins, R. N. (1999). The induced innovation hypothesis and energy-saving technological change. The Quarterly Journal of Economics, 114(3), 941-975.

Romer, P. M. (1986). Increasing returns and long run growth. Journal of Political Economy, 94(5), 1002-1037.

Solow, R. M. (1957). Technical change and the aggregate production function. The Review of Economics and Statistics, 39(3), 312-320.

Wei, M., Patadia, S., & Kammen, D. M. (2010). Putting renewable and energy efficiency to work: How many jobs can the clean energy industry generate in the US? Energy Policy, 38, 919-931.
German Energy Priorities

In the wake of the Fukushima disaster, Germany has decided to phase-out its nuclear power plants by 2022.  Chancellor Angela Merkel announced that Germany would need to replace a substantial amount of this phased-out energy with coal and natural gas power plants.

“If we want to exit nuclear energy and enter renewable energy, for the transition time we need fossil power plants. At least 10, more likely 20 gigawatts [of fossil capacity] need to be built in the coming 10 years.”

However, phasing out its nuclear power plants was first planned by Chancellor Schroeder in 2000.  In 2010, amid much uproar among the German public, their government announced a plan to prolong the lifespan of most nuclear reactors by many years.  Chancellor Merkel’s recent announcement is therefore a return to the previous German plan.

Chancellor Merkel also said that Germany would still attempt to meet its aggressive target of reducing greenhouse gas emissions 40% below 1990 levels by 2020 despite the phaseout of its nuclear plants.  Although such a substantial emissions cut may sound infeasible while phasing out and replacing nuclear power plants, the previous German climate plan – which included phase-out of nuclear power – had also set a goal of 40% emissions cuts below 1990 levels.

Currently Germany produces 44% of its electric power from coal, 23% from nuclear, 13% from natural gas, 6.5% from wind, 5.5% from biomass, 3.3% from hydroelectric, and 2% from solar photovoltaic.  As of 2010, renewable energy sources (including hydroelectric) accounted for nearly 17% of German electricity generation, which is nothing to sneeze at (in comparison, it’s currently approximately 10% in the USA).  Germany intends to more than double that figure to 35% by 2020.

Thus the good news is that Germany plans to replace most of its phased-out nuclear power with renewable energy.  This is a plausible plan, as there have been several studies proposing pathways for Germany to meet 100% of its energy needs from renewable sources within a few decades.  Additionally, because many of the coal power plants are becoming old and require replacement anyway, even with the nuclear power phase-out, Germany planned to decrease coal production from 51.1 gigawatts (GW) in 2010 to 42.9 GW in 2020.

The bad news is that according to Chancellor Merkel, 10–20 GW of new fossil fuel power plants need to be built in order to facilitate the nuclear phase-out.  If the nuclear power plant lifetimes were extended as briefly planned in 2010, the retiring fossil fuel plants could more easily be replaced by renewable energy sources, followed by a replacement of the nuclear plants with renewables as well.  New power plants have lifespans of many decades, so building 10–20 GW of new fossil fuel power will commit Germany to their associated emissions for a long time to come.

Ultimately it’s a problem of priorities.  There has long been an anti-nuclear sentiment amongst the German public, which was amplified by the Fukushima disaster.  However, the public health risk associated with coal power is several times larger than that from nuclear power (Ren et al 1998), and the CO2 emissions associated with nuclear power are approximately 7 times lower than natural gas and 15 times lower than coal (Sovacool 2008).

Thus from a logical and scientific standpoint, Germany should first phase-out the use of more dangerous and environmentally damaging fossil fuels before pursuing a phase-out of nuclear power.  Unfortunately the German public has its priorities backwards, phasing-out the energy source which poses less of a threat to both public health and the global climate. 

It’s also worth noting that according to the German Advisory Council on the Environment, there are scenarios in which Germany could phase-out the use of coal and nuclear power simultaneously, replacing them with renewable energy.  Perhaps Germany can pursue these plans, rather than building the 10-20 gigawatts of additional fossil fuel power Merkel believes is necessary.

If not, we can only hope Germany straightens out its priorities, or they will find it difficult to meet their commendable greenhouse gas emissions reductions targets.  Then again, Germany is already way ahead of the emissions reductions game when compared to many other developed countries like the USA, Australia, and Canada, for example.  In fact, Germany has the benefit of the European Union (EU) carbon emissions trading program – a type of system which the aforementioned countries have thus far failed to implement, but which caps the EU’s total emissions:

“CO2 emissions would rise only in the short term under a phase-out of nuclear power by 2020 instead of 2022. A complete phase-out by 2015, however, would push up CO2 emissions considerably…Climate change mitigation would not be affected, contrary to some widespread beliefs. There is a cap for European greenhouse gas emissions. When one country increases its emissions, they have to be reduced somewhere else.”

In other words, not only does Germany already have a far more aggressive emissions reduction goal than most other developed nations, but it’s also part of the EU, which has implemented a serious system to cap carbon emissions.  It’s also worth noting that German per capita CO2 emissions are approximately half those of the three aforementioned countries, and have already dropped more than 20% since 1990.  Therefore, although Germany may have its priorities backwards in terms of fossil fuel vs. nuclear phase-outs, it’s still far ahead of the USA, Australia, Canada, and others in terms of taking serious steps to reduce greenhouse gas emissions.

This post is an updated version of a post that first appeared on Skepticalscience.com

Climate Change and Scientific Debate – The Messenger Matters

What a week it’s been for the climate debate in Australia. The furore surrounding Christopher Monckton’s visit, the letter signed by 50 academics calling for a cancellation of his speaking engagements, the ensuing backlash against those petitioners by readers of The West Australian and of course Tony Abbott’s very public swipe at the calibre of our leading economists.

After all that, you could be forgiven for thinking the very basis of scientific debate on climate change is in question.

But are the ‘anti-climate change’ arguments posited this past week a fair reflection of changing public opinion regarding climate change?

In March 2011, CSIRO reviewed 21 recent studies examining Australians’ views of climate change, their beliefs about human-induced climate change, their support for various policy responses to climate change and to what extent public views had changed since the previous Garnaut review in 2008. (CSIRO, 2011)

While it is difficult to reconcile the results from all 21 studies (as question framing often differs by study), on balance the review indicates climate change “believers” are still the majority, but are on the decline. For example between 2008 and 2010, the proportion of people who believe climate change is at least partly human induced seems to have dropped about 10 percentage points on average. Accordingly, those who believed climate change was a result of natural causes rose from 21% in 2008 to 31% in 2010. (CSIRO, 2011)

Perhaps, we can blame part of this decline to the politicisation of the issue originating with the announcement of the CPRS (the Rudd-government’s emission trading scheme). As soon as a publically funded mitigation policy was announced, the gloves came off and the issue ceased to be viewed primarily through the lens of scientific enquiry.  

Once politicised, climate change brings to the fore ideologies and rhetoric, enough to dismay any scientist. But all is not lost I believe, once we accept that climate change is, publically, a political issue as much as a scientific issue. We then begin to realise that this challenge to science-based policy is not unique to climate change and we can chart our way forward out of the quagmire of partisan politics.

Overly optimistic?

Let’s see.

In a study of US print media portrayal of the climate debate, Antilla (2005) observed that the attack on climate science replicates previous assaults on science, such as by the pesticide industry (with respect to DDT), coal-burning utilities (when acid rain was identified as a serious environmental problem), and the chemical industry (effect of CFCs on stratospheric ozone).

Nissani (2007, p. 37) notes “there have always been experts willing to back up a ‘profitably mistaken viewpoint’; there have always been efforts ‘to cover the issue in a thick fog of sophistry and uncertainty’ and to ‘unearth yet one more reason why the status quo is best for us’.”

Unfortunately, I haven’t seen Australian research citing similar precedents, but I assume they are there.

So if we accept that the politicisation of climate change is not unique, perhaps we can get over the frustrations that somehow we are missing the ‘magic pudding’ of finely crafted evidence-based scientific discourse.

But why should we doubt the ability for rational argument to win the day – after all, 97% of climate scientists agree that the climate is changing and these changes are largely driven by human activity?

We should perhaps doubt that rational argument alone is sufficient because this is not a game of knowledge or of facts; but a battle for perception.

In their 2010 study “The Persistence of Political Misconceptions”, Nyhan and Reifer posit the correction of incorrect information in polarised political issues does not necessarily lead to a rejection of misconceptions. In fact, through three experiments in the US, they found that the correction of factually incorrect information could backfire, leading to more polarisation. Quoting from their conclusions: “As a result, the corrections fail to reduce misperceptions among the most committed participants. Even worse, they actually strengthen misperceptions among ideological subgroups in several cases” (p. 315).

If last week’s reaction to climate change issues by some segments of the WA public are any indication, the hypotheses put forward by Nyhan and Reifer’s have unfortunately been validated.

So if the correction of factual misconceptions does not always make things better, this implies the energy expended on the correction of misconceptions may be wasted, and the messages that enter into the public dialogue may be largely defined by the political opposition. Hence the dilemma: Do we fight on, or step back from the argument and, perhaps, seek to do no harm? Or is there a ‘third way’?

Returning to the CSIRO research review; while on the decline, ‘climate change’ believers still represent the majority. This suggests the science-based study of climate change, and its consequences have been communicated and largely accepted. On top of this, there is quite likely a group of “undecided’s” (my term, not a group defined by the CSIRO review, but one that forms in relation to any policy issue).

Rather than reacting to the message of the most “rusted on” anti climate change brigade, a more profitable communications strategy might be to identify and target the “undecided’s” (The US the Yale Climate Change Project has named this group “the cautious” representing 21% of the adult population – Yale, 2011). Of course, to effectively communicate with distinct attitudinal groups we need to know their concerns, hopes, dreams and fears; which are unlikely to be restricted to scientific queries.

Therein lies another dilemma. On the one hand, as discussed, the correction of untrue information and errors may just fuel the flames of opposition; on the other hand, aren’t we required to make these corrections?

Yes, but this doesn’t mean we must disengage from the discourse. It is still important to assure that there is regularly refreshed knowledge-based information. It is important that there is education, both formal and informal. It is important that we constantly improve the ability to communicate the essence and the substance of complex problems. In a nutshell, the dilemma is the recognition that incorrect information must be corrected, accompanied by the realisation that such corrections do not necessarily lead to knowledge-based reconciliation of disagreements.

So how to chart a path forward?

I propose that “climate change mitigation” advocates do not hang on in quiet desperation: Instead, there should be a substantial amount of positive information arising from their actions and intellectual energy focused on developing and implementing solutions.

The knowledge from these activities serves not only to promote creativity solutions, but also to diversify the base of people who are advancing climate change as an important issue. Enabling these groups and individuals to air their views, they can take climate change out of the narrowly defined realm and culture of scientists, broadening the message, and revealing more opportunity that comes from addressing climate change as a societal value.

The messenger is critically important here: The most obvious way past the problem of the politicised messenger is to expand and diversify the messenger base. Perhaps the easiest diversification of the messenger base is to engage a far broader cross section of voices from the community of scientists. There are experts outside of the community of authors of classic papers (e.g., the Garnaut Review, CSIRO, etc.). These voices can bring new strength and perspectives to the body of knowledge. Often the most passionate of these voices are young, and if we have confidence in our efforts, then we should have confidence in those who have learned from us.

But in reality, the widest diversification of the messengers of climate change comes from the active inclusion of people who are positioning themselves to adapt to climate change. These responses can be found in energy utilities, local government, the insurance industry,  community actions groups, academics, and government researchers, and they not only bring forward voices who are responding to the body of climate-change knowledge, but they also untangle conflict-of-interest perceptions and provide concrete examples of the translation of climate science to action.

Now to a contentious point; one I’ve been leading up to in this post.  I believe there is an imbalance in the discourse. I believe there are too many people on the solution side, or on the scientific climate-research side and too few on the community side. I think we need to recognise the resources, perceptions, attitudes and behavioural responses inherent in the community and develop the capability for the community to both advance the argument and to contribute to development of the knowledge base.

I advocate, here, a re-framing of the climate and climate-change problem. Rather than this being, primarily, a scientific problem with scientists or an institutional service pushing information to under-informed audiences, we must develop community-based resources that allow for the participation of an informed community in the evolution of climate solutions.

I agree this is simple to say – more difficult to accomplish.

References

Antilla, L, (2005) Climate of scepticism: US newspaper coverage of the science of climate change, Global Environmental Change 15, 338–352.

Essential Media (2010). Position on climate change, available at:

http://www.essentialmedia.com.au/position-on-climate-change/, accessed 20th February, 2011.

Pollack, H., 2008. Uncertain Science in an Uncertain World. Cambridge University Press, Cambridge.

Nissani, M., 2007. Media coverage of the greenhouse effect. Population and Environment: A Journal of Interdisciplinary Studies 21 , 27–43.

Nyhan, B & Reifer, J (2010) “When Corrections Fail: The Persistence of Political Misperceptions”, Political Behavior, 32, 303–330.

Trends in Australian Political Opinion: Results from the Australian Election Study, (2007) 1987-2007.

What rising inequality and materialism does to us

The emphasis on growth as the pre-eminent social goal has seen rises in inequality within societies. In developed economies, the degree of income inequality has been shown to be associated with a wide variety of health and social problems, including reduced trust and civic engagement, which may themselves reduce overall well-being.  One of the consequences of the tendency for people to assess their position relative to others – rather than in absolute terms – is that high levels of inequality in wealth and income are likely to produce greater levels of unhappiness. More people see themselves as losing out, even when they are well off. While there is continuing debate about the exact nature of the relationship, a recent study (Verme, 2011) which investigated a very large global sample found that income inequality has “a negative and significant effect on life satisfaction” and that the result “persists across different income groups and across different types of countries” (p 111). Wilkinson and Pickett (2010) argue that such ill effects of income inequality are not the result of income differences per se but rather are a consequence of social stratification and the associated “social evaluative stress” people experience.

The initial epidemiological research, both within and between nations, found a strong relationship between income inequality and life expectancy: the greater the gap in income between the rich and the poor in a given society, the lower the life expectancy and the greater the incidence of illness for everyone. For example, in his study of national income inequality among eleven industrialised countries, Wilkinson (1992) reported a correlation of -0.81 between indices of inequality and life expectancy after controlling for gross national product per capita.

Changes in inequality over time are also important. Contrast the experiences of Britain and Japan; in 1970 they had similar income distribution and life expectancy but since then have diverged significantly. Japan now has the highest life expectancy in the world and the most egalitarian distribution of any country on record. Conversely, in Britain income distribution widened following the Thatcher experiment in the mid 80s and mortality among men and women between 15-44 years actually increased. In reviewing the international literature on health and income inequalities, Wilkinson argued that “life expectancy in different countries is dramatically improved when income differences are smaller and societies are more socially cohesive” and that “social, rather than material, factors are now the limiting component in the quality of life in developed societies”.

After more than a decade of research on the effects of inequality, Wilkinson (1996) concluded – and he is far from alone in this – that “a wide range of problems associated with relative deprivation…. are all strongly related to one factor—societal measures of income distribution” (p 1). We know now that data from a range of countries show that “the societal scale of income inequality is related to morbidity and mortality, obesity, teenage birth rates, mental illness, homicide, low trust, low social capital, hostility, and racism.” Wilkinson and Pickett’s (2005, 2010) latest work shows that poor educational performance among school children, the proportion of the population imprisoned, deaths from drug overdoses and low social mobility can be safely added to this list. The international research is consistent in showing that “greater income inequality is associated with a higher prevalence of ill health and social problems in a society as a whole” and everyone is affected. One of these effects has been the collapse in intergenerational mobility; children born into disadvantage in the most unequal societies now have reduced prospects of improving their circumstances than their parents and grandparents did.

It is worth noting that, to date, the relationship between these outcomes and income inequality (as opposed to low socio-economic status) within Australia has been little studied. However in international comparisons Australia is ranked among the most unequal nations, with a larger catalogue of social ills compared to more equal societies– higher levels of illegal drug use and mental illness, lower levels of trust, poorer child wellbeing, more obesity and childhood obesity, higher levels of imprisonment, lower social mobility and lower scores on a composite index of health and social problems. Australia also appears as one of the few societies overall where subjective well being has actually declined over recent decades (Inglehart et al., 2008).

Researchers generally agree that inequality amongst Australians is increasing. In fact since 1979, income inequality in Australia has been increasing at faster rate than in comparable developed countries such as France, Germany, Italy, the U.K. and the U.S. Although we are collectively wealthier than we have ever been, we are also a less equal society than we have ever been.

The conclusion that inequality is socially destructive is not novel; close observers of the human condition have often pointed to the apparent association between inequality and impoverished social relations. It is important to understand that the established relationships between income inequality and health and social problems are not trivial: there are ten-fold differences in homicide rates; six-fold differences in teenage birth rates, sixfold differences in the prevalence of obesity, fourfold differences in how much people feel they can trust each other, five- or ten-fold differences in imprisonment rates and three years difference in the average length of life. Many of these social problems, which are related to income inequality, are about human perceptions and behaviour; income inequality has psychosocial effects, probably as a result of chronic stress and the unpleasant experience of relatively low social status, rather than the absolute level of income (Wilkinson & Pickett, 2010).

Materialism

As we have seen, beyond a certain point, the premise that more consumption and greater wealth improve well being does not stand scrutiny. On the contrary, there is strong evidence that at individual level, the more material goals matter to people, the more unhappy they are likely to be. Research here and in other wealthy countries shows that even when people obtain more money and material goods, they do not become more satisfied with their lives or more psychologically healthy.

At some level, people seem to understand this. Surveys in already wealthy countries indicate that many people believe we need a better balance between the pursuit of material goals and the quality of people’s lives. The majority endorse the view that a growing economy – and the acquisition of more “stuff”- is not all that matters in improving wellbeing. Many people appear to feel uneasy about the fact that children today are growing up in winner takes all economy where they are encouraged to see the main purpose in life as getting whatever they can for themselves. In popular culture, selfishness and materialism are no longer seen as moral problems, but as cardinal goals in life. “More for me”, as one TV advertisement boasts.

The influence of consumerism is pervasive and buttressed by an enormous industry whose sole purpose is to drive consumption. The result is that many people have come to evaluate their lives and accomplishments not by looking to their relationships or community, but to what they possess and what they can buy. They come to act as if they believe that the consumption of things will confer real satisfaction and guarantee a full life. Such ideas are often associated with a world view in which the worth and success of others is also judged not by their wisdom or kindness or community contribution, but in terms of whether they possess the right clothes, the right car, or more generally, the right “stuff”. At the same time, judgments about what is enough are not absolute, but relative to others; people judge their own worth by measuring their wealth and possessions against that of others – and since there is always someone with more, this is a recipe for dissatisfaction.

In fact, research shows that merely aspiring to have greater wealth or more material possessions is likely to be associated with increased personal unhappiness. Kasser (2002), amongst others, has shown that people who “strongly value the pursuit of wealth and possessions report lower psychological well-being than those who are less concerned with such aims” (p 5). Using a variety of instruments, his research has shown that those with strong materialistic values and desires report more symptoms of anxiety, report less vitality and feelings of self actualization, are at greater risk of depression, are more narcissistic and experience more bodily discomfort (aches and pains) than those who are less materialistic. They watch more TV, take more alcohol and drugs and have more impoverished personal relationships. 

Australian investigations have generally confirmed these findings. In one study, people who endorsed materialistic values were less satisfied with their lives than those who reported lower levels of materialism (Ryan & Dziurawiec, 2000). Another set of studies by Saunders and his colleagues found that people who score high on materialism were less satisfied with their lives, more likely to suffer from depression and anger, more conformist and less likely to be interested in or protective of the environment. The researchers also found that the same people also to judge their success or failure in terms of their material possessions.

There are many explanations of why materialism can be so toxic: the desire to have more and more goods drives us into more frantic pace of life; people have to work harder and longer to purchase, maintain, replace, insure and constantly manage goods.  This expends the energy necessary for living a fully satisfying life. Economies focused on consumption foster conditions that heighten psychological insecurities: they fuel themselves. Parents work more and more hours outside the home, to acquire the buying power to obtain more goods that they have been taught that they and their children “need”. Attention to children, intimate time with partners and friends, and other satisfactions that cannot be bought are pushed to the periphery.

Materialism is also associated with more anti-social and self-centred behaviour. One of the effects of a materialistic disposition is a greater tendency to treat people as objects to be manipulated and used. Materialistic values conflict with making the world a better place and the desire to contribute to equality, justice and other aspects of civil society. Attitude surveys show that people highly focused on materialistic objectives show little concern for the wider world – they care less about protecting the environment and less about their fellow citizens (Kasser, 2002). 

Conclusion

Accumulating evidence from a variety of disciplines and perspectives points clearly to the conclusion that increasing material wealth does not necessarily improve individual or collective wellbeing. In developed economies, characteristics such as greater income equality, fairly functioning political institutions, and the quality of the environment are more important. High and accelerating levels of economic growth are generating serious problems such as resource insecurity, environmental degradation and social difficulties which contribute to individual discomfort and unhappiness: there is a downside to growth.

One of the reasons policy makers continue to be fixated on increasing GDP as a pre-eminent objective in the face of these effects is that they believe there is no alternative. This represents a failure of the imagination, a refusal to take seriously and develop other possible models which have (somewhat tentatively) been proposed under the heading of steady state or no-growth economics. Even Robert Solow, who won the Nobel prize for economics for his work on growth theory, apparently now describes himself as “agnostic” on whether growth can continue and told Stoll of Harper’s Magazine (March, 2008) that, “There is no reason at all why capitalism could not survive without slow or even no growth. I think it’s perfectly possible that economic growth cannot go on at its current rate forever.. . . . There is nothing intrinsic in the system that says it cannot exist happily in a stationary state”.  John Stuart Mill made a similar argument in 1848: “the increase of wealth is not boundless..and that economists should know that “at the end of what they term the progressive state lies the stationary state, that all progress in wealth is but a postponement of this.”

It is surely time for these ideas to be taken seriously.


References

Kasser, T. (2002). The high price of materialism. Cambridge, MA: MIT Press.

Kasser, T., & Brown, K. W. (2003). On time, happiness, and ecological footprints. In J. deGraaf (Ed.), Take back your time: Fighting overwork and time poverty in America (pp. 107-112). San Francisco: Berrett-Koehler Publishers.

Saunders, S (2000). A snapshot of five materialism studies in Australia. Journal of Pacific Rim Psychology 1 (1), 14–19.

Stevens, P. (2010). Embedment in the environment: A new paradigm for well-being? The Journal of the Royal Society for the Promotion of Health, 130: 265-269.

Rehdanz, K. & Maddison, D. (2005). Climate and happiness, Ecological Economics, 52(1), 111-125.

Stiglitz, J. (2009). A cool calculus of global warming. Project Syndicate Blog.

Verme, P. (2011). Life satisfaction and income inequality. Review of Income and Wealth, 57: 111–127.

Wilkinson, R.G. (1992). Income distribution and life expectancy. British Medical Journal, 304: 165-168.

Wilkinson, R. (1996). Unhealthy Societies: The Afflictions of Inequality. London: Routledge, p 1.

Wilkinson, R. & Pickett, K. (2005).The problems of relative deprivation: Why some societies do better than others. Social Science & Medicine, 65, 1965-1978.

Wilkinson, R. & Pickett, K. (2010). The Spirit Level: Why Equality Is Better for Everyone. London: Penguin books,

A Detailed Look at Renewable Baseload Energy

The myth that renewable energy sources can’t meet baseload (24-hour per day) demand has become quite widespread and widely-accepted.  After all, the wind doesn’t blow all the time, and there’s no sunlight at night.  However, detailed computer simulations, backed up by real-world experience with wind power, demonstrate that a transition to 100% energy production from renewable sources is possible within the next few decades.

Reducing Baseload Demand

Firstly, we currently do not use our energy very efficiently.  For example, nighttime energy demand is much lower than during the day, and yet we waste a great deal of energy from coal and nuclear power plants, which are difficult to power up quickly, and are thus left running at high capacity even when demand is low.  Baseload demand can be further reduced by increasing the energy efficiency of homes and other buildings.

Renewable Baseload Sources

Secondly, some renewable energy sources are just as reliable for baseload energy as fossil fuels.  For example, bio-electricity generated from burning the residues of crops and plantation forests, concentrated solar thermal power with low-cost thermal storage (such as in molten salt), and hot-rock geothermal power.  In fact, bio-electricity from residues already contributes to both baseload and peak-load power in parts of Europe and the USA, and is poised for rapid growth.  Concentrated solar thermal technology is advancing rapidly, and a 19.9-megawatt solar thermal plant opened in Spain in 2011 (Gemasolar), which stores energy in molten salt for up to 15 hours. 

Addressing Intermittency from Wind and Solar

Wind power is currently the cheapest source of renewable energy, but presents the challenge of dealing with the intermittency of windspeed.  Nevertheless, as of 2011, wind already supplies 24% of Denmark’s electricity generation, and over 14% of Spain and Portugal’s.

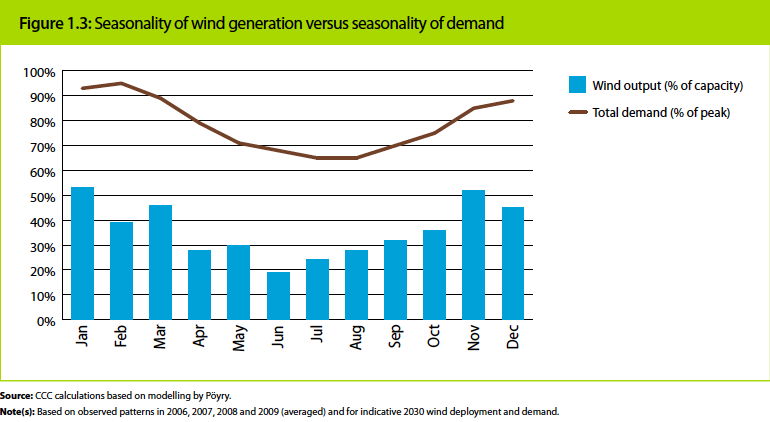
Although the output of a single wind farm will fluctuate greatly, the fluctuations in the total output from a number of wind farms geographically distributed in different wind regimes will be much smaller and partially predictable.  Modeling has also shown that it’s relatively inexpensive to increase the reliability of the total wind output to a level equivalent to a coal-fired power station by adding a few low-cost peak-load gas turbines that are opearated infrequently, to fill in the gaps when the wind farm production is low (Diesendorf 2010).  Additionally, in many regions, peak wind (see Figure 4 below) and solar production match up well with peak electricity demand.

Current power grid systems are already built to handle fluctuations in supply and demand with peak-load plants such as hydroelectric and gas turbines which can be switched on and off quickly, and by reserve baseload plants that are kept hot.  Adding wind and solar photovoltaic capacity to the grid may require augmenting the amount of peak-load plants, which can be done relatively cheaply by adding gas turbines, which can be fueled by sustainably-produced biofuels or natural gas.  Recent studies by the US National Renewable Energy Laboratory found that wind could supply 20-30% of electricity, given improved transmission links and a little low-cost flexible back-up.

As mentioned above, there have been numerous regional and global case studies demonstrating that renewable sources can meet all energy needs within a few decades.  Some of these case studies are summarized below.

Global Case Studies

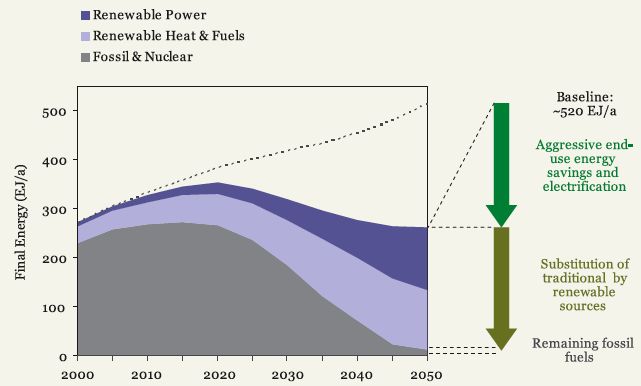
Energy consulting firm Ecofys produced a report detailing how we can meet nearly 100% of global energy needs with renewable sources by 2050.  Approximately half of the goal is met through increased energy efficiency to first reduce energy demands, and the other half is achieved by switching to renewable energy sources for electricity production (Figure 1).

ecofys fig 1

Figure 1: Ecofys projected global energy consumption between 2000 and 2050

Stanford’s Mark Jacobson and UC Davis’ Mark Delucchi (J&D) published a study in 2010 in the journal Energy Policy examining the possibility of meeting all global energy needs with wind, water, and solar (WWS) power.  They find that it would be plausible to produce all new energy from WWS in 2030, and replace all pre-existing energy with WWS by 2050

In Part I of their study, J&D examine the technologies, energy resources, infrastructure, and materials necessary to provide all energy from WWS sources.  In Part II of the study, J&D examine the variability of WWS energy, and the costs of their proposal.  J&D project that when accounting for the costs associated with air pollution and climate change, all the WWS technologies they consider will be cheaper than conventional energy sources (including coal) by 2020 or 2030, and in fact onshore wind is already cheaper. 

European Union Case Study

The European Renewable Energy Council (EREC) prepared a plan for the European Union (EU) to meet 100% of its energy needs with renewable sources by 2050, entitled Re-Thinking 2050.  The EREC plan begins with an average annual growth rate of renewable electricity capacity of 14% between 2007 and 2020.  Total EU renewable power production increases from 185 GW in 2007 to 521.5 GW in 2020, 965.2 GW in 2030, and finally 1,956 GW in 2050.  In 2050, the proposed EU energy production breakdown is:  31% from wind, 27% from solar PV, 12% from geothermal, 10% from biomass, 9% from hydroelectric,   8% from solar thermal, and 3% from the ocean (Figure 2).

EU Renewables

Figure 2: EREC report breakdown of EU energy production in 2020, 2030, and 2050

Northern Europe Case Study

Sørensen (2008) developed a plan through which a group of northern European countries (Denmark, Norway, Sweden, Finland, and Germany) could meet its energy needs using primarily wind, hydropower, and biofuels.  Due to the high latitudes of these countries, solar is only a significant contributor to electricity and heat production in Germany.  In order to address the intermittency of wind power, Sørensen proposes either utilizing hydro reservoir or hydrogen for energy storage, or importing and exporting energy between the northern European nations to meet the varying demand.  However, Sørensen finds:

“The intermittency of wind energy turns out not to be so large, that any substantial trade of electric power between the Nordic countries is called for.  The reasons are first the difference in wind regimes…and second the establishment of a level of wind exploitation considerably greater that that required by dedicated electricity demands.  The latter choice implies that a part of the wind power generated does not have time-urgent uses but may be converted (e.g. to hydrogen) at variable rates, leaving a base-production of wind power sufficient to cover the time-urgent demands.”

Britain Case Study

The Centre for Alternative Technology prepared a plan entitled Zero Carbon Britain 2030.  The report details a comprehensive plan through which Britain  could reduce its CO2-equivalent emissions 90% by the year 2030 (in comparison to 2007 levels).  The report proposes to achieve the final 10% emissions reduction through carbon sequestration.

In terms of energy production, the report proposes to provide nearly 100% of UK energy demands by 2030 from renewable sources.  In their plan, 82% of the British electricity demand is supplied through wind (73% from offshore turbines, 9% from onshore), 5% from wave and tidal stream, 4.5% from fixed tidal, 4% from biomass, 3% from biogas, 0.9% each from nuclear and hydroelectric, and 0.5% from solar photovoltaic (PV) (Figure 3).  In this plan, the UK also generates enough electricity to become a significant energy exporter (174 GW and 150 terawatt-hours exported, for approximately £6.37 billion income per year).

UK Renewables

Figure 3: British electricity generation breakdown in 2030

In order to address the intermittency associated with the heavy proposed use of wind power, the report proposes to deploy offshore turbines dispersed in locations all around the country (when there is little windspeed in one location, there is likely to be high windspeed in other locations), and implement backup generation consisting of biogas, biomass, hydro, and imports to manage the remaining variability.  Management of electricity demand must also become more efficient, for example through the implementation of smart grids

The heavy reliance on wind is also plausible because peak electricity demand matches up well with peak wind availability in the UK (Figure 4, UK Committee on Climate Change 2011).

UK wind seasonality

Figure 4: Monthly wind output vs. electricity demand in the UK

The plan was tested by the “Future Energy Scenario Assessment” (FESA) software. This combines weather and demand data, and tests whether there is enough dispatchable generation to manage the variable base supply of renewable electricity with the variable demand.  The Zero Carbon Britain proposal passed this test.

Other Individual Nation Case Studies

Plans to meet 100% of energy needs from renewable sources have also been proposed for various other individual countries such as Denmark (Lund and Mathiessen 2009), Germany (Klaus 2010), Portugal (Kraja?i? et al 2010), Ireland (Connolly et al 2010), Australia (Zero Carbon Australia 2020), and New Zealand (Mason et al. 2010).  In another study focusing on Denmark, Mathiesen et al 2010 found that not only could the country meet 85% of its electricity demands with renewable sources by 2030 and 100% by 2050 (63% from wind, 22% from biomass, 9% from solar PV), but the authors also concluded doing so may be economically beneficial:

“implementing energy savings, renewable energy and more efficient conversion technologies can have positive socio-economic effects, create employment and potentially lead to large earnings on exports. If externalities such as health effects are included, even more benefits can be expected. 100% Renewable energy systems will be technically possible in the future, and may even be economically beneficial compared to the business-as-usual energy system.”

Summary

Arguments that renewable energy isn’t up to the task because “the Sun doesn’t shine at night and the wind doesn’t blow all the time” are overly simplistic.

There are a number of renewable energy technologies which can supply baseload power.   The intermittency of other sources such as wind and solar photovoltaic can be addressed by interconnecting power plants which are widely geographically distributed, and by coupling them with peak-load plants such as gas turbines fueled by biofuels or natural gas which can quickly be switched on to fill in gaps of low wind or solar production.  Numerous regional and global case studies – some incorporating modeling to demonstrate their feasibility – have provided plausible plans to meet 100% of energy demand with renewable sources.

This is an updated version of a post that first appeared on Skepticalscience.com.

Communicating about Uncertainty in Climate Change, Part II

(This is a two-part post on communicating about probability and uncertainty in climate change. Read Part I.)

In my previous post I attempted to provide an overview of the IPCC 2007 report’s approach to communicating about uncertainties regarding climate change and its impacts.  This time I want to focus on how the report dealt with probabilistic uncertainty.  It is this kind of uncertainty that the report treats most systematically.  I mentioned in my previous post that Budescu et al.’s (2009) empirical investigation of how laypeople interpret verbal probability expressions (PEs, e.g., “very likely”) in the IPCC report revealed several problematic aspects, and a paper I have co-authored with Budescu’s team (Smithson, et al., 2011) yielded additional insights.

The approach adopted by the IPCC is one that has been used in other contexts, namely identifying probability intervals with verbal PEs.  Their guidelines are as follows:
Virtually certain >99%; extremely likely >95%; very likely >90%; likely >66%; more likely than not > 50%; about as likely as not 33% to 66%; unlikely <33%; very unlikely <10%; extremely unlikely <5%; exceptionally unlikely <1%.

One unusual aspect of these guidelines is their overlapping intervals. For instance, “likely” takes the interval [.66,1] and thus contains the interval [.90,1] for “very likely,” and so on.  The only interval that doesn’t overlap with others is “as likely as not.” Other interval-to-PE guidelines I am aware of use non-overlapping intervals. An early example is Sherman Kent’s attempt to standardize the meanings of verbal PEs in the American intelligence community.

Attempts to translate verbal PEs into numbers have a long and checkered history.  Since the earliest days of probability theory, the legal profession has steadfastly refused to quantify its burdens of proof (“balance of probabilities” or “reasonable doubt”) despite the fact that they seem to explicitly refer to probabilities or at least degrees of belief.  Weather forecasters debated the pros and cons of verbal versus numerical PEs for decades, with mixed results. A National Weather Service report on a 1997 survey of Juneau, Alaska residents found that although the rank-ordering of the mean numerical probabilities residents assigned to verbal PE’s reasonably agreed with those assumed by the organization, the residents’ probabilities tended to be less extreme than the organization’s assignments. For instance, “likely” had a mean of 62.5% whereas the organization’s assignments for this PE were 80-100%. 

And thus we see a problem arising that has been long noted about individual differences in the interpretation of PEs but largely ignored when it comes to organizations. Since at least the 1960’s empirical studies have demonstrated that people vary widely in the numerical probabilities they associate with a verbal PE such as “likely.” It was this difficulty that doomed Sherman Kent’s attempt at standardization for intelligence analysts. Well, here we have the NWS associating it with 80-100% whereas the IPCC assigns it 66-100%. A failure of organizations and agencies to agree on number-to-PE translations leaves the public with an impossible brief.  I’m reminded of the introduction of the now widely-used cyclone (hurricane) category 1-5 scheme (higher numerals meaning more dangerous storms) at a time when zoning for cyclone danger where I was living also had a 1-5 numbering system that went in the opposite direction (higher numerals indicating safer zones). 

Another interesting aspect is the frequency of the PEs in the report itself. There are a total of 63 PEs therein.  “Likely” occurs 36 times (more than half), and “very likely” 17 times.  The remaining 10 occurrences are “very unlikely” (5 times), “virtually certain” (twice), “more likely than not” (twice), and “extremely unlikely” (once). There is a clear bias towards fairly extreme positively-worded PEs, perhaps because much of the IPCC report’s content is oriented towards presenting what is known and largely agreed on about climate change by climate scientists. As we shall see, the bias towards positively-worded PEs (e.g., “likely” rather than “unlikely”) may have served the IPCC well, whether intentionally or not.

In Budescu et al.’s experiment, subjects were assigned to one of four conditions. Subjects in the control group were not given any guidelines for interpreting the PEs, as would be the case for readers unaware of the report’s guidelines. Subjects in a “translation” condition had access to the guidelines given by the IPCC, at any time during the experiment. Finally, subjects in two “verbal-numerical translation” conditions saw a range of numerical values next to each PE in each sentence. One verbal-numerical group was shown the IPCC intervals and the other was shown narrower intervals (with widths of 10% and 5%).

Subjects were asked to provide lower, upper and “best” estimates of the probabilities they associated with each PE. As might be expected, these figures were most likely to be consistent with the IPCC guidelines in the verbal- numerical translation conditions, less likely in the translation condition, and least likely in the control condition. They were also less likely to be IPCC-consistent the more extreme the PE was (e.g., less consistent foro “very likely” than for “likely”). Consistency rates were generally low, and for the extremal PEs the deviations from the IPCC guidelines were regressive (i.e., subjects’ estimates were not extreme enough, thereby echoing the 1997 National Weather Service report findings).

One of the ironic claims by the Budescu group is that the IPCC 2007 report’s verbal probability expressions may convey excessive levels of imprecision and that some probabilities may be interpreted as less extreme than intended by the report authors. As I remarked in my earlier post, intervals do not distinguish between consensual imprecision and sharp disagreement. In the IPCC framework, the statement “The probability of event X is between .1 and .9 could mean “All experts regard this probability as being anywhere between .1 and .9” or “Some experts regard the probability as .1 and others as .9.” Budescu et al. realize this, but they also have this to say:

“However, we suspect that the variability in the interpretation of the forecasts exceeds the level of disagreement among the authors in many cases. Consider, for example, the statement that ‘‘average Northern Hemisphere temperatures during the second half of the 20th century were very likely higher than during any other 50-year period in the last 500 years’’ (IPCC, 2007, p. 8). It is hard to believe that the authors had in mind probabilities lower than 70%, yet this is how 25% of our subjects interpreted the term very likely!” (pg. 8).

One thing I’d noticed about the Budescu article was that their graphs suggested the variability in subjects’ estimates for negatively-worded PEs (e.g., “unlikely”) seemed greater than for positively worded PEs (e.g., “likely”). That is, subjects seemed to have less of a consensus about the meaning of the negatively-worded PEs. On reanalyzing their data, I focused on the six sentences that used the PE “very likely” or “very unlikely”. My statistical analyses of subjects’ lower, “best” and upper probability estimates revealed a less regressive mean and less dispersion for positive than for negative wording in all three estimates. Negative wording therefore resulted in more regressive estimates and less consensus regardless of experimental condition.  You can see this in the box-plots below.

Boxplots of probability estimates

In this graph, the negative PEs’ estimates have been reverse-scored so that we can compare them directly with the positive PEs’ estimates. The “boxes” (the blue rectangles) contain the middle 50% of subjects’ estimates and these boxes are consistently longer for the negative PEs, regardless of experimental condition. The medians (i.e., the score below which 50% of the estimates fall) are the black dots, and these are fairly similar for positive and (reverse-scored) negative PEs. However, due to the negative PE boxes’ greater lengths, the mean estimates for the negative PEs end up being pulled further away from their positive PE counterparts.

There’s another effect that we confirmed statistically but also is clear from the box-plots. The difference between the lower and upper estimates is, on average, greater for the negatively-worded PEs.  One implication of this finding is that the impact of negative wording is greatest on the lower estimates—And these are the subjects’ translations of the very thresholds specified in the IPCC guidelines.

If anything, these results suggest the picture is worse even than Budescu et al.’s assessment. They noted that 25% of the subjects interpreted “very likely” as having a “best” probability below 70%. The boxplots show that in three of the four experimental conditions at least 25% of the subjects provided a lower probability of less than 50% for “very likely”. If we turn to “very unlikely” the picture is worse still. In three of the four experimental conditions about 25% of the subjects returned an upper probability for “very unlikely” greater than 80%!

So, it seems that negatively-worded PEs are best avoided where possible. This recommendation sounds simple, but it could open a can of syntactical worms. Consider the statement “It is very unlikely that the MOC will undergo a large abrupt transition during the 21st century.” Would it be accurate to equate it with “It is very likely that the MOC will not undergo a large abrupt transition during the 21st century?” Perhaps not, despite the IPCC guidelines’ insistence otherwise. Moreover, turning the PE positive entails turning the event into a negative. In principle, we could have a mixture of negatively- and positively-worded PE’s and events (“It is (un)likely that A will (not) occur”). It is unclear at this point whether negative PEs or negative events are the more confusing, but inspection of the Budescu et al. data suggested that double-negatives were decidedly more confusing than any other combination.

As I write this, David Budescu is spearheading a multi-national study of laypeople’s interpretations of the IPCC probability expressions (I’ll be coordinating the Australian component). We’ll be able to compare these interpretations across languages and cultures. More anon!

References

Budescu, D.V., Broomell, S. and Por, H.-H. (2009) Improving the communication of uncertainty in the reports of the Intergovernmental panel on climate change. Psychological Science, 20, 299–308.

Intergovernmental Panel on Climate Change (2007). Summary for policymakers: Contribution of Working Group I to the Fourth Assessment Report of the Intergovernmental Panel on Climate Change. Retrieved May 2010 from http://www.ipcc.ch/pdf/assessment-report/ar4/wg1/ar4-wg1-spm.pdf.

Smithson, M., Budescu, D.V., Broomell, S. and Por, H.-H. (2011) Never Say “Not:” Impact of Negative Wording in Probability Phrases on Imprecise Probability Judgments.  Accepted for presentation at the Seventh International Symposium on Imprecise Probability: Theories and Applications, Innsbruck, Austria, 25-28 July 2011. 

Smallholder Farmers essential to Achieve Food Security

The first-ever official meeting of Ministers of Agriculture from G20 countries, to be held in Paris on June 22-23, presents an extraordinary opportunity. Tasked with developing an action plan to address price volatility in food and agricultural markets and its impact on the poor, the ministers are uniquely positioned to not only tackle the immediate price volatility problems, but also to take on a more fundamental and long-term challenge—extreme poverty and hunger.

As experts in agriculture, the ministers no doubt know what extensive research confirms: Investing in agriculture and rural development, with a focus on smallholder farmers, is the best bet for achieving global food security, alleviating poverty, and improving human wellbeing in developing countries. During their upcoming meeting, the G20 ministers should seize the opportunity to call attention to this essential fact and propose a corresponding plan of action.
 
Three years after the 2008 food crisis, expanding biofuel production, rising oil prices, U.S. dollar depreciation, extreme weather, and export restrictions have once again led to high and volatile food prices, threatening the wellbeing of the world’s poorest consumers, who spend up to 70 percent of their incomes on food. Any plan to curb volatility and protect the poor will require decisive action on a number of fronts, including measures to control speculation on agricultural commodities, promote open trade and export bans, establish emergency food reserves, curtail biofuels subsidies, and strengthen social safety nets, especially for women and young children.
 
In addition to these critical steps, achieving food security requires long-term investments to increase the productivity, sustainability, and resiliency of agriculture, especially among smallholder farmers, many of whom live in absolute poverty and are malnourished. Millions of poor, smallholder farmers struggle to raise output on tiny plots of degraded land, far from the nearest market. Lacking access to decent tools, quality seeds, credit, and agricultural extension, and being highly susceptible to the vagaries of weather, they work hard but reap little.
 
These challenges, however, are not insurmountable, and many actually present opportunities. Successes during the Green Revolution in Asia and more recent accomplishments in Africa show that rapid increases in crop productivity among smallholder farmers can be achieved, helping to feed millions of people. When smallholder farmers have equal access to agricultural services, inputs, and technologies, including high-yielding seeds, affordable fertilizer, and irrigation, they have often proven to be at least as efficient as larger farms.
 
Exploiting the vast potential of small-scale agriculture would increase productivity and incomes where they are most needed—Sub-Saharan Africa and South Asia. The two regions are not only home to the majority of smallholder farmers and people suffering from extreme poverty, hunger, and malnutrition, but they also have rapidly growing populations. Improving smallholder agriculture could take pressure off global food and agricultural markets and cushion the negative impact on poor people who are most vulnerable to volatile markets.
 
Harnessing the promise of smallholder farmers, however, will require concerted action in a number of areas. First, investments that improve farmers’ productivity—such as better access to high-quality seeds, fertilizer, and extension and financial services—should be increased along with spending on roads and other rural infrastructure to improve farmers’ access to markets. Investments in agricultural research should focus on new agricultural technologies that are well suited for smallholder farmers, as well as other innovations, including insurance schemes that can reduce the risk small-scale farmers face due to extreme weather and high price volatility.
 
Second, while increasing productivity and incomes is crucial, it is not sufficient. Agricultural development among smallholders should also improve nutrition and health. Growing more nutritious varieties of staple crops that have higher levels of micronutrients like vitamin A, iron, and zinc can potentially reduce death and disease, especially of women and children. Producing more diverse crops, especially fruits and vegetables, can also help to combat malnutrition, and selling more nutritious food could increase incomes and provide additional employment.
 
Third, since smallholder farmers are extremely vulnerable to weather shocks, including escalating threats from global warming, promoting climate change adaptation and mitigation is important to protect against risks and potential crop loss. With the right incentives and technologies, smallholder farmers can invest in mitigation efforts, including managing their land to increase carbon storage. Sub-Saharan Africa, for example, has 17 percent of the world’s potential for climate change mitigation through sustainable agricultural practices.
 
Finally, policies and programs need to narrow the gender gap in agriculture and address the specific constraints faced by women. Although female farmers do much of the work to produce, process, and sell food in many countries, they frequently have less access than men to land, seeds, fertilizer, credit, and training. When women obtain the same levels of education and have equal access to extension and farm inputs, they produce significantly higher yields.
 
When the G20 Ministers of Agriculture develop an action plan to address food price volatility and its impact on the poor, they should focus on both urgent actions and the vital role of smallholder farmers. But before the international community issues any new recommendations, they first need to make good on previous commitments, including the G8’s L’Aquila pledge in 2009 to invest $22 billion in agriculture, which must be targeted to small-scale farmers. When it comes to achieving food security and reducing poverty, poor farmers in developing countries might be part of the challenge, but they are definitely indispensable to the solution.
 

How sustainable is your solar passive house?

So you’ve worked hard with solar passive design concepts to achieve an 8 or 9 star rated house and you feel comfortable you won’t be needing any air-conditioning. You’ve got layers of insulation, double glazed windows, they are in the right spots to keep the sun out in summer and let it in during winter, you can make use of the lovely cooling breeze, and it’s so air tight you could take it to Mars and be comfortable. You’ve also dropped a massive polished concrete slab on the ground for thermal mass, keeping things nice and warm in winter. You’ve then complemented the lovely house with a lovely solar hot water system (perhaps Australian made) and maybe even some solar photovoltaic power panels.

Pretty happy you’ve ticked the box for reducing carbon emissions, and comfortable in the knowledge that while living in it you wont be responsible for any carbon pollution?

Well, what about all the energy and carbon that went into producing the materials for your house, transporting them to site, assembling them, and then maintaining them over its design life? This is generally referred to as “Embodied Energy” and in most cases is responsible for more carbon than the average house will emit through the use of air conditioners over its entire life.

Building the average 4×2 Australian home and then maintaining it (material repairs and replacement) for 40 years results in about 110 tonne of CO2e being produced (Embodied Energy).

To keep this building comfortable with an air conditioner over that same 40 year period, assuming it has now been built to a “Six Star” rating, will produce about 78 tonnes of CO2e. As you can see, the importance considering “Embodied Energy” in the built form sits alongside that of Solar Passive design and Thermal Performance.

The true carbon footprint of a building is determined through quantifying this “Embodied Energy” adding it to the “Operational Energy” (the air conditioner, hot water system, fridges etc) and dividing it by the design life of the building. This process is often referred to as “Life Cycle Assessment” (LCA) and it allows us to truly identify how “sustainable” a product or process is by quantifying its impacts past, present and future.

LCA is an accounting method that assesses each and every impact associated with all stages of a product or process over its life span. It is not a new approach to determining a product’s environmental impacts, but one that has been gaining a lot of momentum recently as people start to ask the tougher questions on the true sustainability of the products they are consuming.

The approach is sometimes referred to as a “Cradle to Cradle” assessment if it accounts for full recycling at the end of the design life of the product, or just “Cradle to Grave” if it takes the product through to disposal only.

As mentioned before, in regards to the built form, LCA requires quantifying the “Embodied Energy”, “Operational Energy” and the “Design Life” or expected lifespan of the building.

Embodied Energy in the built form can be broken down into the following components:

  • Materials – Energy and Carbon used to extract the raw material and process them to a useable building product at the gate of the factory (Cradle to Gate). 
  • Transport – Energy and Carbon used to transport the building material from the factory gate to the building site
  • Assembly – Energy and Carbon used to construct and create the building
  • Recurring – Energy and Carbon used to maintain and replace certain building elements (such as paint) over the entire life span over the building
  • Demolition and Recycling – Energy and Carbon used to demolish and recycle the building and feed these materials back into useable elements

Fortunately for us we have a large data base of materials and their associated “Cradle to Gate” carbon co-efficients given in either kgCO2e/m3 or kgCO2e/kg. To calculate the total “Cradle to Grave” Embodied Energy of your design we need to know the type and volume of materials used, where from and how they were transported from factory to building site, the assembly energy and then how often various components will need to be patched up or replaced over the design life of the building. 

Operational Energy is something that everyone is already pretty familiar with and is dealt with in solar passive design, solar hot water, high-efficiency appliances, and that can be offset using distributed renewable energy (such as a solar PV system).

Design life is ultimately required to amortize the embodied and operational energy over the expected life span of the building. For instance, a house made of recycled cardboard might have a really low initial embodied energy but if it needs to be replaced every two years, then over its life span it is going to look pretty bad.

It is interesting to note that buildings in Australia very rarely get to the end of their design life due to the materials’ durability limit. In other words, Australian homes do not fall over but they get knocked over for redevelopment. According to a 2009 study conducted by Forest & Wood Products Australia, 9 out of 10 buildings in Australia will see this fate.

The average Australian house is lucky to make it past its 40th birthday.

Design life is therefore dictated by design quality, correct density (building high density in high density suburbs) and things such as having adjoining walls so a developer will need to purchase multiple dwellings before they can knock down a set of town houses. If we can design buildings that double in life span (only need to get them to age 80) then we can halve the embodied energy impact.

The key is being able to tie all of the components of “Embodied Energy”, “Operational Energy” and “Design Life” together to ensure you are not compromising one aspect while trying to improve another.

If carbon reduction is your aim you need to complement your energy-efficient solar passive design with a LCA or you might be compromising your environmental objectives.

Fortunately, conducting LCA of the built form using suitable software is now pretty easy. Indeed, many designers are already producing designs that not only remove any carbon from the operational energy but also offset emissions associated with the embodied energy. Better yet, designers are finding that these houses are not only cheaper to run but are often also cheaper to build.

When considering both the embodied energy and the operational energy, the built form is responsible for about 35% of Australia’s carbon footprint. It follows that intelligent design using LCA philosophy can have a substantial impact on reducing Australia’s contribution to climate change.

With Courage We Can Build a Post-Carbon Australia

How many wake up calls do we need? The latest International Energy Agency figures, published recently in The Guardian newspaper, show global carbon emissions are at their highest ever levels.

As IEA chief economist Fatih Birol notes “I am very worried. This is the worst news on emissions. It is becoming extremely challenging to remain below 2 degrees. The prospect is getting bleaker. That is what the numbers say.”

Alongside recently released reports from Professor Ross Garnaut and the Climate Commission this is yet another resounding wake up call for Australians to focus our vision and energy on the nation building challenge of our time: designing and constructing a just and sustainable road to a post-carbon economy and society.

Adaptation will only take us so far

The time has surely now come for Australians to move beyond the foolishness of climate change denial and to honestly face the full consequences of our climate change responsibilities.

We will have to lift our gaze well beyond wishful thinking. We need to let go of the hope we can address climate change risks without significant changes to business-as-usual lifestyles and policies.

Of course we have to help communities deal with the impacts of increasingly frequent and severe extreme weather events. This will take far sighted, strategic investment to build the infrastructure, resilience and adaptability required.

But it is naïve in the extreme to think that adaptation alone will allow us a smooth path through a world in which global warming exceeds four degrees.

As Lord Nicholas Stern warns, a world beyond four degrees will be an utterly different world to the Earth we now know.

“Such warming would disrupt the lives and livelihoods of hundreds of millions of people across the planet, leading to widespread mass migration and conflict. That is a risk any sane person would seek to drastically reduce.”

Alarmist? Ask Heather Smith, Deputy Head of Australia’s Office of National Assessments, who has also noted that current emissions trends have us well on track for global warming of four degrees by 2100.

ONA analysis suggests that, by 2030, decreased water flows from the Himalayan glaciers will already be triggering a “cascade of economic, social and political consequences”.

Does anyone seriously think that adaptation alone will enable Australians to remain immune from changes of this magnitude?

It will take more than a carbon price to get us out of this

We do need to set a price on carbon – but we shouldn’t fool ourselves into thinking that market based mechanisms will, on their own be sufficient.

Clearly a wide variety of policies will be needed to do the heavy lifting to drive innovation and investment in energy efficiency, renewable energy and carbon sequestration.

Germany and Spain are, for example employing a feed-in tariff for large scale wind and solar thermal plants with considerable success.

The key elements for a rapid transition to a zero carbon economy are now well known.

The richest societies and citizens must reduce their material consumption. We must make a complete switch from fossil fuels to renewable energy plus forest and soil based carbon sequestration.

A just and sustainable transition will also require unprecedented investment in adaptation. We will need income and resource redistribution to protect the lives and livelihoods of the most vulnerable and least affluent communities – within and beyond Australia.

Visionary initiatives such as Zero Carbon Australia and Zero Carbon Britain demonstrate that the technological obstacles to the rapid achievement of a zero carbon future are not insurmountable. We need to inspire and encourage a 21st century Renaissance in post carbon creativity and innovation.

Time to catch up, Australia

The recent decisions by conservative governments in the UK, Germany and Japan to set strong emissions reduction and renewable energy targets suggest that the economic and political obstacles can be overcome. It just takes courageous political leadership driven by broad public mobilisation and support.

These decisions should certainly put an end to the nonsense that Australia is leading rather than trailing the world in emissions reduction.

While the German and UK strategies and timescales still fall well short of the required milestones, the contrast with the depressingly narrow political vision being demonstrated in Australia is striking.

The likelihood that Australia will be left behind in the economic paradigm shift to a renewable energy future grows stronger by the day.

Many Australians – particularly young people – believe, with some justification, that it is already too late to prevent significant climate change tipping points and impacts.

An overly linear analysis of current trends in Australian public opinion, political debate and corporate power can lead one to believe the climate change crisis will not end well.

But history has many examples of resistance and transformation against apparently overwhelming odds. The end of slavery; the US civil rights movement; the overthrow of apartheid; and the current democratic revolutions in the Middle East remind us that transformational change rarely occurs in an entirely predictable and linear way.

As German Chancellor Angela Merkel recently noted when she informed the German parliament that, in the light of the Japanese nuclear crisis, Germany would speed up plans to abandon nuclear power and reach the age of renewable energy as soon as possible: “When in Japan the apparently impossible becomes possible, then the situation changes”.

Australians face a stark choice. We can wait for a series of escalating climatic disasters to wake us from our fossil fuelled complacency.

Or we can demonstrate the maturity, leadership and vision needed to ensure that we are part of the solution rather than part of the problem.

(This is an updated version of a piece that was originally published in The Conversation on 30 May 2011.)

References

BBC (2011) “Japan crisis: Germany to speed up nuclear energy exit” BBC News Europe 17 March, 2011 [online: http://www.bbc.co.uk/news/world-europe-12769810 ] accessed 17 March, 2011

Dorling, P. and Baker, R. (2010) ‘Climate change warning over south-east Asia’, The Age, 16 December, 2010 [online: http://www.theage.com.au/national/climate-change-warning-over-southeast-asia-20101215-18y6b.html ] accessed 6 June, 2011  

Garnaut, R. (2011) The Garnaut Review 2011: Australia in the Global Response to Climate Change, Melbourne: Cambridge University Press [online: http://www.garnautreview.org.au/update-2011/garnaut-review-2011.html ] accessed 6 June, 2011

Harvey, F. (2011) ‘Worst ever carbon emissions leave climate on the brink’ The Guardian, 29 May, 2011 [online:  http://www.guardian.co.uk/environment/2011/may/29/carbon-emissions-nuclearpower ], accessed 30 May, 2011

Steffen, W. (2011) The Critical Decade: Climate science, risks and responses, Climate Commission Secretariat, Commonwealth of Australia [online: http://climatecommission.gov.au/wp-content/uploads/4108-CC-Science-WEB_3-June.pdf ] accessed 26 May, 2011

Zero Carbon Australia 2020: http://beyondzeroemissions.org/zero-carbon-australia-2020

Zero Carbon Britain: http://www.zerocarbonbritain.com/


No One Likes Taxes But Sometimes People Don’t Mind

“Read my lips, there’ll be no new taxes”

George Bush accepting the Republican nomination, 1988

George Bush was simply tapping into a rich public attitudinal vein with this statement. Public aversion to increased, new or even just existing taxes, is of course one of the most universally held gripes and we have witnessed collective anger first hand in recent weeks over the carbon tax proposal in Australia.  

Many economists support the concept of Pigouvian taxes (i.e. taxes on externalities, such as CO2 taxes, road usage/anti congestion charges, fossil fuel levies and so on). Conventional economic wisdom is that they are the most efficient tool to redress market failure.  But theoretical elegance aside, when it comes to the nitty gritty of imposing such taxes, opposition from both industry and public has resulted in a graveyard of failed Pigouvian environmental tax proposals: For example, the French carbon tax in 2010, road pricing in Edinburgh in 2005, a tax on fossil fuels in Switzerland in 2000, the fuel tax escalator in the UK in 2000, and the US energy tax in 1993, to name just a few.

 Fortunately, in recent years there has been a growing body of behavioural research examining the factors that influence public support for Pigouvian taxation, and what can be done to make such taxes more feasible. One of the most comprehensive of such studies was the eight country EU PETRAS project (2006) In this post we’ll outline some of the more pertinent learning from these studies to provide some insight as to how public support for environmental taxes can be bolstered.

So what does the research say?
Factors influencing support for environmental taxes

It seems one of the main reasons for public opposition to environmental taxes is poor understanding of the rationale behind them. Several studies from the 2006 PETRAS Pan European research project found that many people across the EU felt uninformed about environmental taxes —what they were and how they work, and this heightened already existing suspicion of government motives (Dresner et al., 2006a).

One of the promoted benefits of environmental taxes is the so-called ‘double dividend’. The rationale is that the tax burden should fall more on ‘bads’ than ‘goods’, a process that may lead to a ‘double dividend’ whereby higher taxes on energy will lower energy use and hence pollution, while lower taxes on labour will contribute to higher rates of employment. The ‘double dividend’ concept was explored in depth in the PETRAS research and though some people were sceptical that such a transfer would actually occur, conceptually the idea was appealing (Baranzini et al., 2000).

The same research highlighted a clear paradox though. There emerged a widely held belief that governments cannot be trusted to use the tax revenue to the benefit of key stakeholders (e.g. through recycling of revenues to lower employment taxes; Dresner et al. 2006a).

Interestingly across the countries surveyed for the PETRAS project, there was a strong feeling that if revenue recycling was carried out by a body independent of government, then this would increase trust and ‘willingness to pay’. The independent body would control the revenues and could certify that they really went where they were supposed to. While the feasibility of such a system might prove difficult, such suggestions highlight a salient desire of stakeholders for measures and processes that are transparent and trustworthy (Dresner et al., 2006). Here in Australia, Professor Ross Garnaut, the government’s chief climate change adviser, only yesterday recommended an independent body be set up, to mandate emissions targets; though not to manage revenue recycling.

While transparent revenue recycling has appeal for some of the public and business groups, there was another point of view that emerged.  For many, especially public respondents, there was a stated preference for revenue raised from environmental taxes to be spent for environmental purposes. For these people, if revenues from a tax imposed supposedly for the sake of the environment went to other purposes, then that was seen as a confidence trick. Perhaps the case is that if you do not believe environmental taxes will improve the environment by altering behaviour, then earmarking the revenues for environmental purposes might do the trick (Dresner et al. 2006; Hsu et al. 2008; Schade & Schlag, 2003; Steg et al, 2006; Thalmann, 2004).

It also seems the notion of pilot ‘trials’ for programmes may spur public and business support. In a separate study to the PETRAS project, Winslott-Hiselius et al. (2009)  studied the Stockholm congestion charge trials and suggested that such trials may be a more useful tool to aid the implementing of ‘difficult’ policy measures. One explanation for this result was that trials generate tangible results that can be clearly witnessed—thus working to reduce feelings of fear and uncertainty while leaving open the possibility that the measure may be abolished if it fails.

So how can these insights inform our own tax debate? Of course attitudes and belief systems in Australia may differ somewhat. Nonetheless several of the European observations represent core ‘human truths’ and a recognition of such ‘truths’ seems to be missing from the current discourse. For example, a real fear of the unknown and the need for policy makers to assuage that fear with comprehensive but easily digestible information; the distrust of command and control systems and the resulting need to ensure tax revenue collected from constituents is clearly and transparently re-directed as benefits to the same; whether that be through environmental or tax reform.

Finally these observations point to the need to develop clear message strategies for complex policy initiatives such as a carbon tax; strategies that unequivocally convey the problem such initiatives intend to address, the end benefits such actions will deliver, and concrete ‘reasons to believe’ in both the problem and the benefits of a solution. Some might argue such clear message strategies have so far been missing from the debate.

References and further reading

Dresner, S., Dunne, L., Clinch, P., P., Beuermann, C., 2006a. Social and political responses to ecological tax reform in Europe: an introduction to the special issue. Energy Policy 34 (8), 895–904.

Dresner, S., Jackson, T., Gilbert, N., 2006b. History and social responses to environ- mental tax reform in the United Kingdom. Energy Policy 34 (8), 930–939.

Hsu, S.L., Walters, J., Purgas, A., 2008. Pollution tax heuristics: an empirical study of willingness to pay higher gasoline taxes. Energy Policy 36, 3612–3619.

Kahan, D., D., Braman, H., Jenkins-Smith, 2010. Cultural Cognition of Scientific Consen- sus, Cultural Cognition Project Working Paper No. 77, www.culturalcognition.net.

Kallbekken, S., Aasen, M., 2010. The demand for earmarking: results from a focus group study in Norway. Ecological Economics 69 (11), 2183–2190.

Kallbekken, S., Kroll, S., Cherry, T.L., in press. Do you not like Pigou or do you not understand him? Tax aversion and earmarking in the lab. Journal of Environmental Economics and Management. doi:10.1016/j.jeem.2010.10.006.

List, J.A., Sturm, D.M., 2006. How elections matter: theory and evidence from environmental policy. Quarterly Journal of Economics 121 (4), 1249–1281.

Rienstra, S.A., Rietveld, P., Verhoef, E.T., 1999. The social support for policy measures in passenter transport. A statistical analysis for the Netherlands. Transportation Research D, 181–200.

Rivlin, A.M., 1989. The continuing search for a popular tax. American Economic Review 79 (2), 113–117.

Steg, L., Dreijerink, L., Abrahamse, W., 2006. Why are energy policies acceptable and effective? Environment and Behavior 38, 92–111.

Stern, P.C., 2000. Toward a Coherent Theory of Environmentally Significant Behavior. Journal of Social Issues 56 (3), 407–424.

Stern, P.C., Dietz, T., Kalof, L., 1993. Value orientations, gender, and environmental concern. Environment and Behavior 25, 322–348.

Thalmann, P., 2004. The public acceptance of green taxes: 2 million voters express their opinion. Public Choice 119, 179–217.

Winslott-Hiselius, L.,Brundell-Freij, K.,Vagland, (2009).The development of public attitudes towards the Stockholm congestiontrial. Transportation Research Part A43(3),269–282.