All posts by Dana Nuccitelli

Climate of Doubt Strategy #2: Exaggerate Uncertainty

The PBS Frontline program Climate of Doubt did a masterful job in exposing the tactics climate denialists have used to delay meaningful action in reducing greenhouse gas emissions and addressing climate change in the USA.  The #1 strategy they have pursued involves denying the scientific consensus on human-caused global warming.  As the program discussed, a similar secondary strategy has involved exaggerating the uncertainties in climate science.  For example, a 1998 American Petroleum Institute memo stated:

“Victory will be achieved when average citizens “understand” (recognize) uncertainties in climate science”

There are two important points to be made here.  First, while it is important to understand the remaining uncertainties in climate science, it is critical to also realize how much we do understand about the climate.  Second, when it comes to climate change, uncertainty is not our friend.

Continue reading Climate of Doubt Strategy #2: Exaggerate Uncertainty

Climate of Doubt Strategy #1: Deny the Consensus

The PBS Frontline program Climate of Doubt did a masterful job in exposing the tactics climate denialists have used to delay meaningful action in reducing greenhouse gas emissions and addressing climate change in the USA.  Perhaps the #1 strategy they have pursued involves denying the scientific consensus on human-caused global warming.  As Myron Ebell of the right-wing think tank Competitive Enterprise Institute (CEI) put it,

“We felt that if you concede the science is settled and that there’s a consensus…the moral high ground has been ceded to the alarmists.”

Republican Congressman from Wisconsin and climate denialist James Sensenbrenner explained the importance of the public awareness of the scientific consensus:

JOHN HOCKENBERRY: Do you think this will ever be settled scientifically, if 97 percent consensus doesn’t settle it for you?

Rep. JAMES SENSENBRENNER: Well, I — you know, I think that it’s up to the scientists and their supporters to convince the public that this is the right thing to do. And the supporters of that side of the argument in the Congress have been a huge flop.

The Consensus is Real

As Frontline correspondent John Hockenberry noted, there is a consensus amongst 97% of climate scientists that humans are driving global warming.  Continue reading Climate of Doubt Strategy #1: Deny the Consensus

Current climate action and the need for more

The Australian government’s Climate Commission has recently released a new Critical Decade report about International Action on Climate Change.  The report notes that this decade is critical in reducing human greenhouse gas emissions, that we have all the technology necessary to do so, and examines the policies of various countries toward that end.  Their findings are summarized in Figure 1 (Figure 3.2 on Page 34 of the report).

Fig 3.2

Figure 1: Implemented and planned climate change actions in some major emitting economies.  Blue represents a sub-national action, pink represents a planned national action, and red represents an implemented national action.

Australia for example has done quite well, having implemented a carbon pricing system, renewable energy target, and energy efficiency standards on a national scale, with national transportation efficiency standards planned.  However, their success depends on whether opposition leader Tony Abbott succeeds in his promise to repeal the carbon pricing system, if he is elected as Prime Minister in 2013.  But at the moment, Australia is moving in the right direction.

China and India have done similarly well, having implemented a version of three of the four actions, with plans to implement the fourth.  Their emissions targets could still use tightening, but for developing countries which are often scapegoated and used by developed nations as an excuse not to reduce their own emissions (as Mitt Romney did), China and India are on the right track.  China in particular has been investing heavily in renewable energy.

The USA on the other hand is arguably doing the worst on the list.  So far a few individual states have implemented carbon pricing systems.  The Regional Greenhouse Gas Initiative (RGGI) has been a success for 9 states, but is a modest system, only targeting power plant emissions.  Most promising is California’s far more aggressive cap and trade system, set to take effect in 2013.  California has long led the way in the USA on environmental issues, so hopefully the California system will be a model that the rest of the country will follow.  While some states have renewable energy and building efficiency standards, the USA is lagging behind on these actions on a national scale as well.

The European Union (EU) deserves high praise for being the only major economy to have achieved all four emissions reduction actions, despite the challenge of achieving agreement between 27 member nations.  The EU has long led the way on carbon emissions, implementing a cap and trade system in 2005, having set ambitious emissions reductions targets, having per person emissions that are less than half of those in the USA, Canada, and Australia, and which in general has been the global model on climate policy.  This is evident for example in their installation of solar energy, where EU nations have three of the top four and four of the top seven nations in installed capacity (Figure 2).

fig 3.4

Figure 2: Top nations in solar photovoltaic installed capacity (gigawatts).  Figure 3.4 in the latest Critical Decade report.

Japan also deserves much credit, being third on the list in Figure 4 (ahead of the much more populous USA), and with per person greenhouse gas emissions at a similar level to those in the EU.

Canada is not depicted in Figure 1 above, but is in a similar situation as the USA.  The per person emissions are roughly the same, and there has been some action on a local level (for example British Columbia’s successful carbon tax), but there has been far too little action on a national level.  Canada also has local, but not national renewable energy targets.  The current national government has paid some lip service to climate change, but has taken few steps to actually address the issue, has pushed hard to develop the tar sands, and has generally treated climate scientists as pests.

How Do We Catalyze More Climate Policy?

If we fail to take serious action very soon to reduce our greenhouse gas emissions, the future climate will be much less hospitable than today’s, with potentially catastrophic results; however, our political leaders are currently failing to take the necessary steps to avoid a potentially catastrophic future.  This begs an important question – how do we change that?  Let’s begin with the large-scale changes that are necessary, and work backwards to see what we can do as individuals on a smaller scale to make those big changes happen.

Pricing or Regulating Carbon Emissions?

In order to achieve the necessary large-scale greenhouse gas emissions reductions, some form of government action is required.  There is simply no way we can stay within our carbon emissions budget with only individual or small-scale efforts.  On a national level, emissions can be reduced through simple government regulation, as the USA  has begun implementing through the Environmental Protection Agency.

However, putting a price on carbon emissions will generally have a smaller economic impact than government regulations.  A carbon emissions price allows consumers to consider the costs of these emissions and adjust their purchasing decisions accordingly, effectively allowing the free market to assist in the emissions reductions.  Currently, carbon emissions are what’s known as an economic “externality” – a factor whose true costs are not included in the price of associated products (i.e. fossil fuels). 

Carbon emissions do damage through their impacts as a result of climate change (for example, economic losses via damaged crops from increased drought frequency), but that cost is not currently reflected in the products’ market price, so consumers cannot take them into account when they purchase fossil fuels.  Economists consider this type of externality an economic and free market failure.

There are many different options in implementing carbon pricing – a carbon tax, cap and trade system, cap and dividend, etc.  Each has upsides and downsides which are worth debating, but the important first step is to remedy this market failure and put some sort of price on carbon emissions.

Fortunately, some governments have listened to these economists and implemented carbon pricing systems, as discussed above, but more action is necessary.  So how do we ensure that the countries with national carbon pricing systems keep and strengthen them, and convince the countries without such national systems to implement them?

Demand Climate Policy

Most of us live in democracies, and we can therefore influence national climate policy by making our priorities known.  Climate change is the gravest threat humans currently face, and it should therefore be at the top of policymakers’ list of priorities.  However, in a democracy, policymakers’ priorities are generally determined by the voters who put them in office.

So first of all, we can make climate policy one of our top determining factors in who we vote for.  We can write letters and/or sign petitions to our policymakers to ensure they know our vote is contingent on their support for climate policy.  We can encourage other voters to follow suit.  The only way to make carbon pricing a top priority for our policymakers is to show them that it’s a top priority for their voting constituents.

Educate People

Before they will make it a top priority, people must first understand the magnitude of the climate problem, which many currently do not.  In the USA for example, while a majority of the population supports climate policy, they do not see it as a priority.  Until the issue is considered a top priority by voters, there is no pressure for policymakers to implement carbon pricing.

The climate disinformation campaign has been very effective on this issue.  Despite the overwhelming consensus amongst climate experts that humans are causing global warming, only 53% of Americans believe humans are the primary cause, and only 58% believe that most scientists agree that global warming is even occurring.

According to the March 2012 George Mason Center for Climate Change Communication (CCCC) national poll, climate scientists are the most trusted source for climate science information, with 74% of public trust (Figure 3).

trust

Figure 3: Responses to the George Mason CCCC poll question “How much do you trust or distrust the following as a source of information about global warming?”

Thus as Ding et al. (2011) concluded, if a larger percentage of people realized that there is a scientific consensus on the issue amongst the group they trust most on the subject, more people would believe that humans are causing global warming, and more people would demand that we do something about it.  Thus it is critical to educate people not just on the scientific evidence, but perhaps more importantly, about the existence of the expert climate consensus.

A populace can only make informed decisions if it is adequately informed, and right now the public as a whole is misinformed about climate change.  We can all make a difference on this issue by educating those we know, and we believe Skeptical Science is a good resource to accomplish this.  However, our individual and collective reach is limited – most people are informed (and/or misinformed) by the mainstream media.

Demand Factually Accurate News

Unfortunately the mainstream media tends to believe that false balance is more important than factually accurate reporting.  Too many journalists and news organizations are afraid of being labeled as “biased” if they do not report “both sides” of a story, even if one side is not supported by the evidence.  Thus the climate contrarian position receives nearly as much media coverage as the mainstream position, even though the contrarians comprise less than 3% of climate experts.  This over-representation of the climate contrarian position in the mainstream media for the sake of false balance is undoubtedly the main reason why such a large percentage of the populace is unaware of the climate consensus.

So how do we influence the mainstream media to prioritize factually accurate reporting over false balance?  Just as politicians are influenced by their voting constituencies, the media can be influenced by its viewers/readers.  Television advertising dollars are often driven by the number of viewers, newspaper advertising dollars are driven by the number of subscribers, and online media advertising dollars are driven by the number of pageviews. 

An independent study demonstrated that viewers prefer quality TV programming.  We can reward good stories and media outlets by viewing and subscribing to them (and encouraging others to follow suit) and discourage bad stories and media outlets by ignoring them; thus we can begin to influence journalists’ priorities by making them recognize that their readers value factual accuracy over false balance.

This is something of a challenge for Skeptical Science, because we believe debunking climate myths in the mainstream media is an important exercise, but we draw attention to those stories in the process.  By quoting directly from the stories, we do allow our readers to see the myths and debunkings without necessarily having to read the stories themselves and give them additional pageviews.  However, we may reduce our number of mainstream media debunkings in the future.  As they say, “do not feed the trolls.”

Using Social Media

We can each extend our individual reach on this issue through the use of social media.  For example, when encountering a factually accurate mainstream media story which does not fall into the false balance trap, we can share it on social media sites like Twitter and Facebook to encourage those in our social media circle to also view the article and add to its traffic.  Right now the media also tends to operate under the principle that “controversy sells,” and climate contrarian positions inevitably create the controversy that generates viewer traffic. 

Only by increasing traffic to the stories that focus on factually accurate information rather than creating a false sense of controversy can we convince the media otherwise, and social media is a useful tool to accomplish that.

Summary

Only when the media focuses on factually accurate reporting will the public become correctly informed on climate change.  Only then will the public come to understand that the experts are in agreement about the climate threat, and that we must make it a priority.  Only then will the public demand that our policymakers take action to address climate change, and only then will those policymakers implement serious climate change mitigation policies.

It’s important to remember that in both democratic and capitalist systems, we each have a significant amount of influence.  Our traffic drives advertising dollars for the media, and our votes determine our policymakers’ priorities.  We can each extend our individual influence through the tools of the internet such as social media.  So let’s get to work and solve this problem.

This post is based on two posts published on Skeptical Science.

German Energy Priorities

In the wake of the Fukushima disaster, Germany has decided to phase-out its nuclear power plants by 2022.  Chancellor Angela Merkel announced that Germany would need to replace a substantial amount of this phased-out energy with coal and natural gas power plants.

“If we want to exit nuclear energy and enter renewable energy, for the transition time we need fossil power plants. At least 10, more likely 20 gigawatts [of fossil capacity] need to be built in the coming 10 years.”

However, phasing out its nuclear power plants was first planned by Chancellor Schroeder in 2000.  In 2010, amid much uproar among the German public, their government announced a plan to prolong the lifespan of most nuclear reactors by many years.  Chancellor Merkel’s recent announcement is therefore a return to the previous German plan.

Chancellor Merkel also said that Germany would still attempt to meet its aggressive target of reducing greenhouse gas emissions 40% below 1990 levels by 2020 despite the phaseout of its nuclear plants.  Although such a substantial emissions cut may sound infeasible while phasing out and replacing nuclear power plants, the previous German climate plan – which included phase-out of nuclear power – had also set a goal of 40% emissions cuts below 1990 levels.

Currently Germany produces 44% of its electric power from coal, 23% from nuclear, 13% from natural gas, 6.5% from wind, 5.5% from biomass, 3.3% from hydroelectric, and 2% from solar photovoltaic.  As of 2010, renewable energy sources (including hydroelectric) accounted for nearly 17% of German electricity generation, which is nothing to sneeze at (in comparison, it’s currently approximately 10% in the USA).  Germany intends to more than double that figure to 35% by 2020.

Thus the good news is that Germany plans to replace most of its phased-out nuclear power with renewable energy.  This is a plausible plan, as there have been several studies proposing pathways for Germany to meet 100% of its energy needs from renewable sources within a few decades.  Additionally, because many of the coal power plants are becoming old and require replacement anyway, even with the nuclear power phase-out, Germany planned to decrease coal production from 51.1 gigawatts (GW) in 2010 to 42.9 GW in 2020.

The bad news is that according to Chancellor Merkel, 10–20 GW of new fossil fuel power plants need to be built in order to facilitate the nuclear phase-out.  If the nuclear power plant lifetimes were extended as briefly planned in 2010, the retiring fossil fuel plants could more easily be replaced by renewable energy sources, followed by a replacement of the nuclear plants with renewables as well.  New power plants have lifespans of many decades, so building 10–20 GW of new fossil fuel power will commit Germany to their associated emissions for a long time to come.

Ultimately it’s a problem of priorities.  There has long been an anti-nuclear sentiment amongst the German public, which was amplified by the Fukushima disaster.  However, the public health risk associated with coal power is several times larger than that from nuclear power (Ren et al 1998), and the CO2 emissions associated with nuclear power are approximately 7 times lower than natural gas and 15 times lower than coal (Sovacool 2008).

Thus from a logical and scientific standpoint, Germany should first phase-out the use of more dangerous and environmentally damaging fossil fuels before pursuing a phase-out of nuclear power.  Unfortunately the German public has its priorities backwards, phasing-out the energy source which poses less of a threat to both public health and the global climate. 

It’s also worth noting that according to the German Advisory Council on the Environment, there are scenarios in which Germany could phase-out the use of coal and nuclear power simultaneously, replacing them with renewable energy.  Perhaps Germany can pursue these plans, rather than building the 10-20 gigawatts of additional fossil fuel power Merkel believes is necessary.

If not, we can only hope Germany straightens out its priorities, or they will find it difficult to meet their commendable greenhouse gas emissions reductions targets.  Then again, Germany is already way ahead of the emissions reductions game when compared to many other developed countries like the USA, Australia, and Canada, for example.  In fact, Germany has the benefit of the European Union (EU) carbon emissions trading program – a type of system which the aforementioned countries have thus far failed to implement, but which caps the EU’s total emissions:

“CO2 emissions would rise only in the short term under a phase-out of nuclear power by 2020 instead of 2022. A complete phase-out by 2015, however, would push up CO2 emissions considerably…Climate change mitigation would not be affected, contrary to some widespread beliefs. There is a cap for European greenhouse gas emissions. When one country increases its emissions, they have to be reduced somewhere else.”

In other words, not only does Germany already have a far more aggressive emissions reduction goal than most other developed nations, but it’s also part of the EU, which has implemented a serious system to cap carbon emissions.  It’s also worth noting that German per capita CO2 emissions are approximately half those of the three aforementioned countries, and have already dropped more than 20% since 1990.  Therefore, although Germany may have its priorities backwards in terms of fossil fuel vs. nuclear phase-outs, it’s still far ahead of the USA, Australia, Canada, and others in terms of taking serious steps to reduce greenhouse gas emissions.

This post is an updated version of a post that first appeared on Skepticalscience.com

A Detailed Look at Renewable Baseload Energy

The myth that renewable energy sources can’t meet baseload (24-hour per day) demand has become quite widespread and widely-accepted.  After all, the wind doesn’t blow all the time, and there’s no sunlight at night.  However, detailed computer simulations, backed up by real-world experience with wind power, demonstrate that a transition to 100% energy production from renewable sources is possible within the next few decades.

Reducing Baseload Demand

Firstly, we currently do not use our energy very efficiently.  For example, nighttime energy demand is much lower than during the day, and yet we waste a great deal of energy from coal and nuclear power plants, which are difficult to power up quickly, and are thus left running at high capacity even when demand is low.  Baseload demand can be further reduced by increasing the energy efficiency of homes and other buildings.

Renewable Baseload Sources

Secondly, some renewable energy sources are just as reliable for baseload energy as fossil fuels.  For example, bio-electricity generated from burning the residues of crops and plantation forests, concentrated solar thermal power with low-cost thermal storage (such as in molten salt), and hot-rock geothermal power.  In fact, bio-electricity from residues already contributes to both baseload and peak-load power in parts of Europe and the USA, and is poised for rapid growth.  Concentrated solar thermal technology is advancing rapidly, and a 19.9-megawatt solar thermal plant opened in Spain in 2011 (Gemasolar), which stores energy in molten salt for up to 15 hours. 

Addressing Intermittency from Wind and Solar

Wind power is currently the cheapest source of renewable energy, but presents the challenge of dealing with the intermittency of windspeed.  Nevertheless, as of 2011, wind already supplies 24% of Denmark’s electricity generation, and over 14% of Spain and Portugal’s.

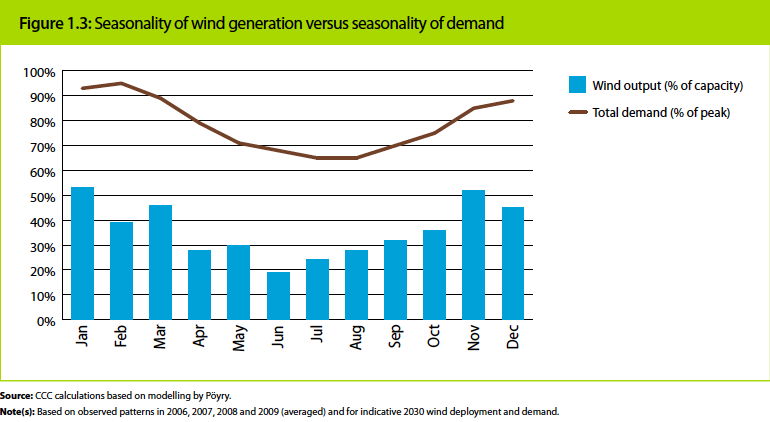
Although the output of a single wind farm will fluctuate greatly, the fluctuations in the total output from a number of wind farms geographically distributed in different wind regimes will be much smaller and partially predictable.  Modeling has also shown that it’s relatively inexpensive to increase the reliability of the total wind output to a level equivalent to a coal-fired power station by adding a few low-cost peak-load gas turbines that are opearated infrequently, to fill in the gaps when the wind farm production is low (Diesendorf 2010).  Additionally, in many regions, peak wind (see Figure 4 below) and solar production match up well with peak electricity demand.

Current power grid systems are already built to handle fluctuations in supply and demand with peak-load plants such as hydroelectric and gas turbines which can be switched on and off quickly, and by reserve baseload plants that are kept hot.  Adding wind and solar photovoltaic capacity to the grid may require augmenting the amount of peak-load plants, which can be done relatively cheaply by adding gas turbines, which can be fueled by sustainably-produced biofuels or natural gas.  Recent studies by the US National Renewable Energy Laboratory found that wind could supply 20-30% of electricity, given improved transmission links and a little low-cost flexible back-up.

As mentioned above, there have been numerous regional and global case studies demonstrating that renewable sources can meet all energy needs within a few decades.  Some of these case studies are summarized below.

Global Case Studies

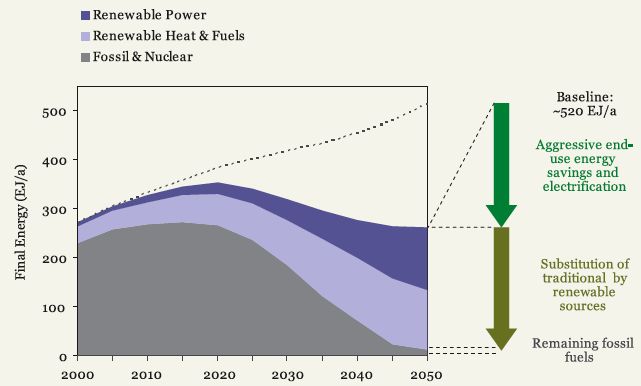
Energy consulting firm Ecofys produced a report detailing how we can meet nearly 100% of global energy needs with renewable sources by 2050.  Approximately half of the goal is met through increased energy efficiency to first reduce energy demands, and the other half is achieved by switching to renewable energy sources for electricity production (Figure 1).

ecofys fig 1

Figure 1: Ecofys projected global energy consumption between 2000 and 2050

Stanford’s Mark Jacobson and UC Davis’ Mark Delucchi (J&D) published a study in 2010 in the journal Energy Policy examining the possibility of meeting all global energy needs with wind, water, and solar (WWS) power.  They find that it would be plausible to produce all new energy from WWS in 2030, and replace all pre-existing energy with WWS by 2050

In Part I of their study, J&D examine the technologies, energy resources, infrastructure, and materials necessary to provide all energy from WWS sources.  In Part II of the study, J&D examine the variability of WWS energy, and the costs of their proposal.  J&D project that when accounting for the costs associated with air pollution and climate change, all the WWS technologies they consider will be cheaper than conventional energy sources (including coal) by 2020 or 2030, and in fact onshore wind is already cheaper. 

European Union Case Study

The European Renewable Energy Council (EREC) prepared a plan for the European Union (EU) to meet 100% of its energy needs with renewable sources by 2050, entitled Re-Thinking 2050.  The EREC plan begins with an average annual growth rate of renewable electricity capacity of 14% between 2007 and 2020.  Total EU renewable power production increases from 185 GW in 2007 to 521.5 GW in 2020, 965.2 GW in 2030, and finally 1,956 GW in 2050.  In 2050, the proposed EU energy production breakdown is:  31% from wind, 27% from solar PV, 12% from geothermal, 10% from biomass, 9% from hydroelectric,   8% from solar thermal, and 3% from the ocean (Figure 2).

EU Renewables

Figure 2: EREC report breakdown of EU energy production in 2020, 2030, and 2050

Northern Europe Case Study

Sørensen (2008) developed a plan through which a group of northern European countries (Denmark, Norway, Sweden, Finland, and Germany) could meet its energy needs using primarily wind, hydropower, and biofuels.  Due to the high latitudes of these countries, solar is only a significant contributor to electricity and heat production in Germany.  In order to address the intermittency of wind power, Sørensen proposes either utilizing hydro reservoir or hydrogen for energy storage, or importing and exporting energy between the northern European nations to meet the varying demand.  However, Sørensen finds:

“The intermittency of wind energy turns out not to be so large, that any substantial trade of electric power between the Nordic countries is called for.  The reasons are first the difference in wind regimes…and second the establishment of a level of wind exploitation considerably greater that that required by dedicated electricity demands.  The latter choice implies that a part of the wind power generated does not have time-urgent uses but may be converted (e.g. to hydrogen) at variable rates, leaving a base-production of wind power sufficient to cover the time-urgent demands.”

Britain Case Study

The Centre for Alternative Technology prepared a plan entitled Zero Carbon Britain 2030.  The report details a comprehensive plan through which Britain  could reduce its CO2-equivalent emissions 90% by the year 2030 (in comparison to 2007 levels).  The report proposes to achieve the final 10% emissions reduction through carbon sequestration.

In terms of energy production, the report proposes to provide nearly 100% of UK energy demands by 2030 from renewable sources.  In their plan, 82% of the British electricity demand is supplied through wind (73% from offshore turbines, 9% from onshore), 5% from wave and tidal stream, 4.5% from fixed tidal, 4% from biomass, 3% from biogas, 0.9% each from nuclear and hydroelectric, and 0.5% from solar photovoltaic (PV) (Figure 3).  In this plan, the UK also generates enough electricity to become a significant energy exporter (174 GW and 150 terawatt-hours exported, for approximately £6.37 billion income per year).

UK Renewables

Figure 3: British electricity generation breakdown in 2030

In order to address the intermittency associated with the heavy proposed use of wind power, the report proposes to deploy offshore turbines dispersed in locations all around the country (when there is little windspeed in one location, there is likely to be high windspeed in other locations), and implement backup generation consisting of biogas, biomass, hydro, and imports to manage the remaining variability.  Management of electricity demand must also become more efficient, for example through the implementation of smart grids

The heavy reliance on wind is also plausible because peak electricity demand matches up well with peak wind availability in the UK (Figure 4, UK Committee on Climate Change 2011).

UK wind seasonality

Figure 4: Monthly wind output vs. electricity demand in the UK

The plan was tested by the “Future Energy Scenario Assessment” (FESA) software. This combines weather and demand data, and tests whether there is enough dispatchable generation to manage the variable base supply of renewable electricity with the variable demand.  The Zero Carbon Britain proposal passed this test.

Other Individual Nation Case Studies

Plans to meet 100% of energy needs from renewable sources have also been proposed for various other individual countries such as Denmark (Lund and Mathiessen 2009), Germany (Klaus 2010), Portugal (Kraja?i? et al 2010), Ireland (Connolly et al 2010), Australia (Zero Carbon Australia 2020), and New Zealand (Mason et al. 2010).  In another study focusing on Denmark, Mathiesen et al 2010 found that not only could the country meet 85% of its electricity demands with renewable sources by 2030 and 100% by 2050 (63% from wind, 22% from biomass, 9% from solar PV), but the authors also concluded doing so may be economically beneficial:

“implementing energy savings, renewable energy and more efficient conversion technologies can have positive socio-economic effects, create employment and potentially lead to large earnings on exports. If externalities such as health effects are included, even more benefits can be expected. 100% Renewable energy systems will be technically possible in the future, and may even be economically beneficial compared to the business-as-usual energy system.”

Summary

Arguments that renewable energy isn’t up to the task because “the Sun doesn’t shine at night and the wind doesn’t blow all the time” are overly simplistic.

There are a number of renewable energy technologies which can supply baseload power.   The intermittency of other sources such as wind and solar photovoltaic can be addressed by interconnecting power plants which are widely geographically distributed, and by coupling them with peak-load plants such as gas turbines fueled by biofuels or natural gas which can quickly be switched on to fill in gaps of low wind or solar production.  Numerous regional and global case studies – some incorporating modeling to demonstrate their feasibility – have provided plausible plans to meet 100% of energy demand with renewable sources.

This is an updated version of a post that first appeared on Skepticalscience.com.

Cutting Emissions and Growing the Economy

Putting a price on carbon emissions is often discussed as one of the main solutions to anthropogenic global warming.  Carbon dioxide is a pollutant and in economic theory, pollution is considered a negative externality – a negative effect on a party not directly involved in a transaction, which results in a market failure.  The Stern Review on the Economics of Climate Change concluded that climate change represents “the greatest example of market failure we have ever seen.”

Despite the economic benefits of addressing this market failure, many skeptics argue that putting a price on carbon emissions will cripple the economy.  Such arguments generally focus solely on the costs associated with pricing carbon while wholly ignoring the benefits.  For example, a Heritage Foundation analysis of the Waxman-Markey climate bill proposed in the US House of Representatives in 2009 concluded that the legislation would cost the average American family $1500 per year – a figure 10 times higher than any non-partisan economic analysis (see below). 

The reason the Heritage estimate was so high is that it evaluated the costs of a carbon cap, and then ignored the distribution of those funds.  When a price is put on carbon emissions, it creates a revenue stream.  The funds which are generated from the carbon price can be distributed in any number of ways – usually through reductions in other taxes, investment in research and development of ‘green’ technologies, funding of energy efficiency programs, etc. 

The Heritage Foundation report effectively assumed that the generated funds would disappear into a black hole.  Their analysis was the equivalent of doing your household finances by adding up your expenditures while ignoring your income.  It sure looks bad, but tells you nothing about your overall finances.

Here we will look at a few of the climate bills proposed by the U.S. Congress which would have put a price on carbon emissions, and examine a number of economic analyses mainly by non-partisan economic groups which evaluated both the costs and benefits of each proposal.

Carbon Pricing Proposals

Lieberman-McCain (2007)

Senators Lieberman and McCain introduced the Climate Stewardship and Innovation Act of 2007.  This bill would have capped greenhouse gas (GHG) emissions at 22% below their 1990 levels in the year 2030, and 60% below 1990 levels in 2050.  The Energy Information Administration (EIA) analyzed this bill using the National Energy Modeling System (NEMS), and the US Environmental Protection Agency (EPA) analyzed the bill as well.

Lieberman-Warner (2008)

Senators Lieberman and Warner introduced the Climate Security Act of 2008.  The bill called for a steadily-declining GHG cap, reaching 15% below 2005 levels by the year 2020 and 70% below 2005 levels by 2050.  It was analyzed by the EPA using results from two economic forecasting models: the ADAGE model developed at Research Triangle Institute (RTI) in North Carolina; and the IGEM model run by a consulting firm founded by Dale Jorgenson, a professor at Harvard.  The Massachusetts Institute of Technology (MIT) analyzed this bill using their Emissions Prediction and Policy Analysis (EPPA) model, and the EIA and Congressional Budget Office (CBO) also analyzed the bill.

Waxman-Markey (2009)

Congressmen Waxman and Markey introduced the American Clean Energy and Security Act of 2009.  This bill would have reduced greenhouse gas emissions 17% below 2005 levels by 2020 and 83% by 2050.  It was analyzed by the CBO, EPA, EIA, and Science Applications International Corporation (SAIC).

Kerry-Lieberman (2010)

Senators Kerry and Lieberman introduced the American Power Act.  This bill would have reduced greenhouse gas emissions 17% below 2005 levels by 2020 and 83% by 2050.  It was analyzed by the Peterson Institute, EPA, EIA.

Generic Policy

Research groups (MIT, RTI, and the Department of Energy’s Pacific Northwest National Laboratories [PNNL]) have also analyzed the economic impacts of a generic comprehensive, economy-wide climate policy to reduce GHG emissions 50-80% by the year 2050.

Study Assumptions

These studies compare a particular climate policy scenario with a reference scenario corresponding to the model projection of business as usual (BAU) – that is, a world in which the economy continues on its current course with carbon emissions unchecked.  All assume that a climate policy would be implemented in the year 2012, and most project economic impacts through the year 2050.  The analyses evaluate the costs of reducing greenhouse gas emissions, but do not measure the resulting payoff – the benefits of averting dangerous climate change.  Nor do they consider the ancillary benefits, such as the improved local air quality and reduced ocean acidification. 

They merely compare the economic impact of the climate policy to a BAU scenario where climate change does not impact the economy.  Therefore, it is important to bear in mind that these analyses overestimate the policy impact on the economy as compared to a realistic BAU scenario in which climate change impacts the economy.  These analyses should be viewed as a comparison between policy impacts and a scenario in which our understanding of the climate is wrong and the climate does not change significantly as GHG emissions continue to rise. 

Since it is difficult to predict how much climate change will impact the economy, or how much climate change will be averted as a result of these policies (particularly since they may trigger similar GHG emission reduction policies by other countries), the comparison to an unrealistic BAU scenario is the best we can do.

Impact on Gross Domestic Product (GDP)

The majority of these analyses find that the evaluated climate policies impact the US GDP by less than 1% as compared to BAU.  The main exception is the IGEM analysis, which finds a 2.15% reduction in GDP for the Lieberman-Warner by bill by 2030, and a 3.59% reduction by 2050 compared to BAU.  The IGEM model is an outlier because it assumes when the price of energy (and other goods and services) rises, people will respond by choosing to work less than they otherwise would (EDF 2008).  This is a counter-intuitive and illogical assumption, since increasing costs generally result in people working more to increase income correspondingly.

Another outlier was the SAIC analysis of Waxman-Markey, which was funded by the National Association of Manufacturers, which has strongly opposed climate legislation.  The study incorporated some unrealistically conservative and pessimistic assumptions, for example that American companies will be unable to deploy clean energy and energy efficiency technologies in a timely manner.  Nevertheless, the report concluded that by 2030, GDP would grow 95% as much under Waxman-Markey as compared to BAU.

The MIT analysis in the generic 80% GHG emissions reductions below 1990 levels below 2050 (the scenario with the largest GHG emissions decrease) found that by 2030, GDP would increase by just 0.44% less as compared to BAU.

Figure 1 and Table 1: Modeled Impacts of Climate Legislation on US GDP

Legislation GHG Reduction by 2050GDP loss vs. BAU by 2030
 Lieberman-McCain 60% below 1990 levels 0.23%
 Lieberman-Warner 70% below 2005 levels 0.44-2.15%
 Waxman-Markey 83% below 2005 levels 0.2-0.9%
 Kerry-Lieberman 83% below 2005 levels 0.1-1.0%
 Generic50% below 1990 levels 0.47-0.81%
 Generic 80% below 1990 levels 0.44%

It is crucial to recognize that “GDP loss” here does not refer to a net shrinkage of GDP; on the contrary, the GDP is still growing, but it is growing fractionally more slowly than it would do under the BAU scenario. This distinction is an important one, but it is often overlooked or intentionally confused by those who seek to obstruct action on climate.

Impact on the Federal Deficit

The CBO analysis of Waxman-Markey found that the bill would reduce the federal deficit by $9 billion by the year 2019.  The CBO analysis of a similar bill proposed by Senators Kerry and Boxer found the bill would reduce the federal deficit by $21 billion by 2019 and “would not increase the deficit in any of the four 10-year periods following 2019.”  And the CBO also found that Kerry-Lieberman would decrease the deficit by $19 billion by 2020.

Impact on Energy Independence

In the MIT analysis of Lieberman-Warner, the United States would spend $20 billion less on foreign oil in the year 2020, and $81 billion less in 2030. 

Impact on Gasoline Prices

The EIA study of Lieberman-Warner found that the bill would add 42 cents per gallon to gas prices in 2030 as compared to BAU (a 12% increase).  Analyses of Waxman-Markey found that it would increase gas prices 22 to 35 cents per gallon by 2030 (6 to 9%).  The Peterson Institute analysis of Kerry-Lieberman found it would increase gas prices by approximately 10 cents per gallon (3%) by 2030 vs. BAU.

Impact on Utility Bills

Analyses of Waxman-Markey found that its impacts on monthly utility bills by 2030 ranged from a $5.60 decrease to a $2.80 increase vs. BAU.  The Peterson Institute analysis of Kerry-Lieberman found that by 2030, monthly utility bills would range between a $0.67 decrease and a $2.62 increase compared to BAU.

The potential decrease in monthly electric bills is due to the energy efficiency programs established through the bill’s provisions.  Though energy prices are expected to increase modestly, energy consumption is expected to counteract these increases as households take advantage of these energy efficiency programs.

Impact on Household Costs

The analyses of Waxman-Markey concluded that the bill would cost the average American household between $84 and $160 per year by 2020, which corresponds to $0.67 to $1.28 per person per week.  The majority of the increase comes through increased gasoline costs.  The studies also concluded that the costs would be lower for lower income families.  For example, the CBO analysis of Waxman-Markey concluded that families in the lowest income quintile would see a net decrease in average annual costs of about $125 in 2020 due to low-income assistance provisions (CBPP 2009).

Over the entire span of the Waxman-Markey bill (to 2050), EPA found the average annual cost would be $80 to $110 per household in current dollars (64 to 88 cents per person per week).

Cost-Benefit Analysis

Although most economic analyses of these policy proposals only estimated the costs, a study by the New York University School of Law’s Institute for Policy Integrity (IPI) also evaluated the benefits of Waxman-Markey by using a range of possible values for the social cost of carbon (SCC).  SCC is effectively an estimate of the direct effects of carbon emissions on the economy, and takes into consideration such factors as net agricultural productivity loss, human health effects, property damages from sea level rise, and changes in ecosystem services. It is a difficult number to estimate, but is key to any cost-benefit analysis of climate legislation. Figure 2 from the IPI study illustrates how the direct benefits of Waxman-Markey compare to the costs for two economic models (ADAGE and IGEM) in relation to SCC in Figure 1.

Figure 2: Costs (light blue and red points) and Benefits (dark blue and purple points) vs. SSC values ($ per ton of carbon dioxide) for H.R. 2454 using two economic models (ADAGE and IGEM)

As you can see in Figure 2, for an SCC of just $9 per ton of carbon dioxide, the direct benefits of H.R. 2454 match the costs.  Estimated SCC values generally range from $19 to $68; therefore, IPI concludes that the direct benefits of Waxman-Markey outweigh the costs by a factor of 2 to 8, and would result in a net savings of at least $1 trillion by 2050.  This neglects indirect benefits such as a reduction in co-pollutants and ocean acidification, and is thus a very conservative estimate.

Real-World Example

Ten northeastern states in the USA (Connecticut, Delaware, Maine, Maryland, Massachusetts, New Hampshire, New Jersey, New York, Rhode Island, and Vermont) implemented a carbon cap and trade system which will reduce their CO2 emissions from the power sector by 10% by 2018 in the Regional Greenhouse Gas Initiative (RGGI).  The RGGI recently commissioned a study to examine the impacts of the system, and the results give us a real-world example which is broadly consistent with the economic study predictions of benefits outweighing costs.

The study found that by investing carbon funds in energy efficiency and renewable energy programs, the states achieved $3–4 savings for every dollar invested.  The program also created thousands of jobs (18,000 job years – that is, the equivalent of 18,000 full-time jobs that last one year), and individuals and businesses who took advantage of the energy efficiency programs funded by the carbon pricing system actually saw their energy bills drop.  RGGI provides us with a real-world example of carbon pricing benefits exceeding the costs several times over.

Bottom Line – Carbon Pricing is Relatively Cheap

To summarize, most of these economic analyses agree that a carbon pricing policy will reduce U.S. GDP-growth by less than 1% over the next 10–40 years as compared to an unrealistically optimistic BAU scenario in which climate change does not impact the economy.  In other words, the economy might grow by around 3% instead of by 4% under BAU.

The analyses also concluded that the evaluated policies would reduce the federal deficit.  Gas prices would rise somewhere between 3% and 12% over the next 20 years compared to BAU.  Although energy prices would rise modestly, energy costs would be offset through increased efficiency.  Total household costs would rise somewhere in the ballpark of 75 cents per person per week vs. BAU.  Studies which conclude costs will be significantly higher either make unrealistic assumptions or only consider half of the picture.

In addition, energy independence and air quality would be improved.  The reduction in GHG emissions would be a major step toward addressing both climate change and ocean acidification, although these beneficial impacts were not included in these economic analyses.

In short, even when compared to the perfect world where climate change has no impact on the economy, carbon pricing would have a very minimal economic impact, and would have several ancillary benefits.  Compared to the real world in which unchecked increasing GHG emissions will certainly lead to numerous adverse economic impacts, putting a price on carbon emissions to reduce those impacts will almost certainly prove to be a net economic benefit.  A cost-benefit analysis concludes that direct benefits of carbon pricing would outweigh the costs by a factor of at least 2, and would result in a net savings of at last $1 trillion by 2050.

(This is an updated and extended version of a post that has previously appeared on Skepticalscience).

A Plan for 100% Renewable Energy by 2050

We recently examined how Australia can meet 100% of its electricity needs from renewable sources by 2020.  Here we will examine how that goal can be scaled up for the rest of the world.

Energy consulting firm Ecofys produced a report detailing how we can meet nearly 100% of global energy needs with renewable sources by 2050.  Approximately half of the goal is met through increased energy efficiency to first reduce energy demands, and the other half is achieved by switching to renewable energy sources for electricity production (Figure 1).

ecofys fig 1

Figure 1: Ecofys projected global energy consumption between 2000 and 2050

To achieve the goal of 100% renewable energy production, Ecofys forsees that global energy demand in 2050 will be 15% lower than in 2005, despite a growing population and continued economic development in countries like India and China.  In their scenario:

“Industry uses more recycled and energy-efficient materials, buildings are constructed or upgraded to need minimal energy for heating and cooling, and there is a shift to more efficient forms of transport.

As far as possible, we use electrical energy rather than solid and liquid fuels. Wind, solar, biomass and hydropower are the main sources of electricity, with solar and geothermal sources, as well as heat pumps providing a large share of heat for buildings and industry. Because supplies of wind and solar power vary, “smart” electricity grids have been developed to store and deliver energy more efficiently.  Bioenergy (liquid biofuels and solid biomass) is used as a last resort where other renewable energy sources are not viable.”

To achieve the necessary renewable energy production, Ecofys envisions that solar energy supplies about half of our electricity, half of our building heating, and 15% of our industrial heat and fuel by 2050.  This requires an average annual solar energy growth rate much lower than we’re currently achieving – an encouraging finding.

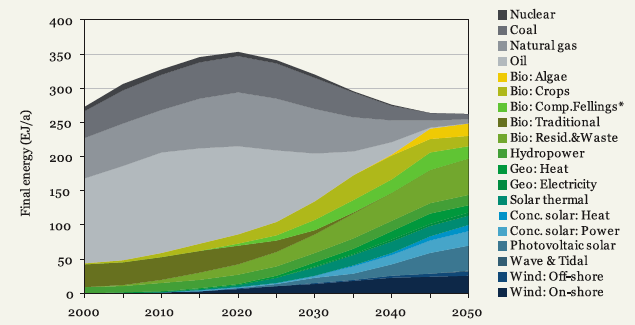
The report notes that wind could meet one-quarter of the world’s electricity needs by 2050 if current growth rates continue, and sets that as its goal.  Ecofys also envisions more than one-third of building heat coming from geothermal sources by 2050.  If we double current geothermal electricity production growth rates, it can provide 4% of our total electricity needs by that date.  Ocean power, through both waves and tides, accounts for about 1% of global electricity needs in 2050.  Hydropower, which currently supplies 15% of global electricity, ultimately supplies 12% in the Ecofys scenario.  As you can see in Figure 2, global renewable energy use ramps up gradually between now and 2050.

ecofys fig 4

Figure 2: Energy use by source between 2000 and 2050

Burning biomass (such as plant and animal waste) will supply 60% of industrial fuels and heat, 13% of building heat, and 13% of electricity needs.  Much of the proposed biomass use comes from plant residues from agriculture and food processing, sawdust and residues from forestry and wood processing, manure, and municipal waste.  All of these renewable energy technologies currently exist, and it’s just a matter of implementing them on a sufficiently large scale.

Ecofys also envisions using currently existing technology and expertise to “create buildings that require almost no conventional energy for heating or cooling, through airtight construction, heat pumps and sunlight.  The Ecofys scenario foresees all new buildings achieving these standards by 2030.”  2–3% of existing buildings will also need to be retrofitted per year to improve energy efficiency.  Ecofys notes that Germany is already retrofitting buildings at this rate.  Transportation must become more efficient, using more fuel efficient vehicles like electric cars, and increasing use of mass public transportation.

Accomplishing all of this will require a major effort, but Ecofys has a number of suggestions how we can start:

  • Introduce minimum efficiency standards worldwide for all products that consume energy, including buildings
  • Build energy conservation into every stage of product design
  • Introduce strict energy efficiency criteria for all new buildings
  • Introduce an energy tax, or perhaps a carbon emissions price
  • Help developing countries pursue alternatives to inefficient biomass burning, such as such as improved biomass cooking stoves, solar cookers and small-scale biogas digesters
  • Substantial investment in public transportation
  • Make individuals, businesses, and communities more aware of their energy consumption, and encourage increased efficiency

Undoubtedly you’re wondering how much this will all cost.  Ecofys finds that we will need to divert up to 3% of global gross domestic product (GDP) to investments in materials and energy efficiency, renewable energy, and necessary infrastructure.  However, we also save money in terms of reduced fossil fuel use.

The report finds that we can save nearly 4 trillion Euros ($5.7 trillion) per year by 2050 based on energy efficiency savings and reduced fuel costs, as compared to business-as-usual.  The up-front investments are expensive, but savings will begin to exceed those costs by 2040, and even sooner if oil prices rise faster than expected, or if we factor in the costs of climate change and the impact of burning fossil fuels on public health.  The plan will reduce energy-related greenhouse-gas emissions 80% below 1990 levels by 2050, which will give us a fighting chance to avoid the 2°C global warming “danger limit”.

There’s a saying, “where there’s a will, there’s a way”.  In this case we have a way to fully transition from fossil fuels to renewable energy by 2050.  The question is, do we have the will?

A Plan for 100% Energy from Wind, Water, and Solar by 2050

We recently examined how Australia can meet 100% of its electricity needs from renewable sources by 2020, and the Ecofys plan to meet nearly 100% of global energy needs with renewable sources by 2050.  Here we will look at another similar, but perhaps even more ambitious plan.

Stanford’s Mark Jacobsen and UC Davis’ Mark Delucchi (J&D) recently published a study in the journal Energy Policy examining the possibility of meeting all global energy needs with wind, water, and solar (WWS) power.  They find that it would be plausible to produce all new energy from WWS in 2030, and replace all pre-existing energy with WWS by 2050. 

In Part I of their study, J&D examine the technologies, energy resources, infrastructure, and materials necessary to provide all energy from WWS sources.  They use the U.S. Department of Energy’s Energy Information Administration (EIA) estimates of global power consumption.  The EIA projects that by 2030, global power demand will increase to 17 trillion watts from the current consumption of 12.5 trillion watts, or an increase of about 36%.  This is the global energy demand that the J&D plan must meet by 2030.  J&D describe how they chose WWS technologies in their study:

“we consider only options that have been demonstrated in at least pilot projects and that can be scaled up as part of a global energy system without further major technology development.  We avoid options that require substantial further technological development and that will not be ready to begin the scale-up process for several decades.”

“In order to ensure that our energy system remains clean even with large increases in population and economic activity in the long run, we consider only those technologies that have essentially zero emissions of greenhouse gases and air pollutants per unit of output over the whole ‘‘lifecycle’’ of the system.  Similarly, we consider only those technologies that have low impacts on wildlife, water pollution, and land, do not have significant waste-disposal or terrorism risks associated with them, and are based on primary resources that are indefinitely renewable or recyclable.”

J&D note that these criteria exclude nuclear power from their study for two primary reasons.  Firstly, expansion of nuclear power to additional countries also increases the number of nations which are able to obtain enriched uranium for potential nuclear weapons.  Secondly, nuclear energy results in 9–25 times more carbon emissions than wind energy, due to the mining, refinement, and transportation of nuclear fuel; the much longer time involved in building a nuclear facility (approximately 4 times longer than WWS facilities); and larger building footprint.  Additionally, the long planning-to-operation times for new nuclear power plants (11 to 19 years) make it an infeasible technology to rely on for a significant amount of new energy production by 2030.

For auto transportation, J&D propose a combination of battery electric vehicles, hydrogen fuel cell cars, and battery-hydrogen hybrids.  For ships, they propose the use of hybrid hydrogen fuel cell-battery systems, and for aircraft, liquefied hydrogen combustion.  The hydrogen fuel is produced through electrolysis using WWS energy.  J&D note that electric cars are 5 times more efficient than internal combustion engine vehicles, so less energy is needed to fuel them.

For building water and air heating and cooling, J&D propose using air-and ground-source heat-pump water and air heaters and electric resistance water and air heaters.  These technologies are in existence today.

In terms of electricity generation, J&D find that the available supply could more than meet the global demand.

“Wind in developable locations can power the world about 3–5 times over and solar, about 15–20 times over.”

J&D find that water will be a relatively small contribution to overall energy production, since wave power is only practical near coastlines, and most areas suitable for hydroelectric power generation are already in use.  Overall in 2030, J&D envision 50% of global power demand will be met by wind, 20% by concentrated solar thermal power, 14% by solar photovoltaic (PV) power plants, 6% by solar PV on rooftops, 4% each by geothermal and hydroelectric, and 1% each from waves and tides.  This will require a major construction effort – nearly 4 million 5-megawatt wind turbines, and nearly 90,000 300-megawatt solar PV plus thermal power plants, for example.  J&D note that we have all of the necessary resources and materials to meet these construction goals.

J&D also note that by transitioning to more efficient technologies (for example, battery electric vehicles over the internal combustion engine, electric heat pumps for homes, and solar thermal energy with storage to provide baseload power rather than fossil fuels and nuclear) we can actually reduce global power production by 30% compared to business-as-usual.  Even though global energy demand is the same in either case, effectively we will need to produce less energy because less is wasted through inefficient fossil fuel burning. 

In Part II of the study, J&D examine the variability of WWS energy, and the costs of their proposal.  On the positive side, J&D note that WWS technologies suffer less downtime than traditional power sources.  For example, the average US coal power plant was down 12.5% of the time for maintenance between 2000 and 2004, while wind turbines have a downtime of 0 to 5%, and commercial solar in the ballpark of 1%.  The downside is that sunlight and windspeed aren’t very reliable.  J&D offer 7 suggestions for solving this problem:

  1. Interconnect the grid so that areas can be supplied with a mix of wind, solar, and water energy (often when the sun isn’t shining, the wind is blowing, and water power is consistently available)
  2. Use a consistent source, like hydroelectric or geothermal, to fill the solar and wind gaps
  3. Create a smart grid to use energy most efficiently
  4. Use energy storage technologies
  5. Build more WWS than needed, so that there’s still supply when wind and sunlight are low
  6. Use electric vehicle batteries as a storage medium
  7. Utilize weather forecasts to anticipate energy demands

J&D envision that a combination of most of these strategies will be used to ensure that there is always enough energy production to meet local and global demands.

As for costs, J&D project that when accounting for the costs associated with air pollution and climate change, all the WWS technologies they consider will be cheaper than conventional energy sources (including coal) by 2020 or 2030, and in fact onshore wind is already cheaper.  U.S. Energy Secretary Steven Chu recently agreed with this assessment.

To accomplish this major conversion to WWS energy, J&D note that it will require that governments implement policies to mobilize infrastructure changes more rapidly than would occur if development were left mainly to the free market, but that we have all the manpower, materials, technology, and resources necessary to make it happen.

“With sensible broad-based policies and social changes, it may be possible to convert 25% of the current energy system to WWS in 10–15 years and 85% in 20–30 years, and 100% by 2050”

As with the Ecofys plan, we are given a roadmap to transition away from fossil fuels and towards renewables in a timely fashion.  Again the question remains whether we have the will to make it happen.

Northeast USA Carbon Pricing Benefits Exceed Costs

The key obstacle to the implementation of carbon pricing in the USA is the fairly widespread myth that it will result in ballooning energy bills and cripple the economy.  These myths perservere despite the fact that as we have previously explored, economic studies consistently conclude that the costs of carbon pricing proposals are very minimal, and the benefits consistently outweigh the costs several times over.

The flaw with these studies is that they’re generally based on hypothetical legislation which has not been implemented.  So it’s easy for “skeptics” to claim that they contain flawed assumptions and thus dispute their conclusions.  However, in 2008, ten northeastern states in the USA (Connecticut, Delaware, Maine, Maryland, Massachusetts, New Hampshire, New Jersey, New York, Rhode Island, and Vermont) implemented a carbon cap and trade system which will reduce their carbon dioxide (CO2) emissions from the power sector by 10% by 2018 in the Regional Greenhouse Gas Initiative (RGGI).  The RGGI recently commissioned a study to examine the impacts of the system, and the results are broadly consistent with the economic studies discussed above.

Funds Generated and Invested

All in all, through the first two years of the system, the ten states generated $789 million through the auctioning and direct sale of CO2 emissions allowances.  Each state developed its own plan for investing those funds, but overall, 52% was used for energy efficiency programs, 14% for energy bill payment assistance, including assistance to low-income ratepayers, and 11% to accelerate deployment of renewable energy technologies.  New York, New Hampshire, and New Jersey also diverted some of the funds to reduce their state budget deficits. 

Table 1: Percent of RGGI State Investments By Category

Considering that energy efficiency is by far the most cost-effective way to reduce CO2 emissions, at about 2.5 cents to save a kilawatt-hour (kWh), whereas it costs at least 6 cents per kWh to generate electricity from conventional sources (ACEEE 2009), it’s not surprising that the RGGI states chose to invest the majority of the carbon allocation funds on energy efficiency programs.

Benefits Exceeded Costs

A key finding in the report involved the comparison of the RGGI state costs and savings from their carbon fund investments:

“Evaluations of several energy efficiency and renewable energy programs in the RGGI participating states indicate that these programs provide $3-$4 in savings for every dollar invested. When macroeconomic benefits are considered, the benefits are even greater.”

Note that this analysis does not include the benefits associated with averting climate change, reducing emissions of co-pollutants, reducing ocean acidification, etc.  Despite this narrow focus, the carbon pricing system resulted in direct benefits exceeding costs several times over.

Job Creation

The RGGI report also found that the program has created jobs.

“A 2010 analysis by Environment Northeast estimates that energy efficiency programs funded with CO2 allowance proceeds through December 2010 are projected to create nearly 18,000 job years – that is, the equivalent of 18,000 full-time jobs that last one year.  Employment benefits result from state program investments and from the reinvestment of consumer energy bill savings in the wider economy. While there has not yet been a similar analysis of RGGI-funded renewable energy programs, data from the Renewable Energy Policy Project shows every $1 million invested in renewable energy systems creates about six full-time manufacturing jobs, as well as additional jobs in construction and facility maintenance.”

Reduced Energy Bills

One of the most frequently-used arguments about carbon pricing is that it will result in much higher energy bills, as utilities pass on the price of carbon emissions to consumers.  However, this assumption fails to account for the re-investment of the funds generated through carbon pricing.  For example, as discussed above, the RGGI states invested the majority of the carbon funds (66% combined) into energy efficiency and energy bill payment assistance programs. 

“At the household and business level, energy efficiency investments enhance consumers’ control over their energy use, typically reducing energy bills by 15 to 30 percent.”

Unfortunately, while it concluded that individuals who took advantage of energy efficiency programs reduced their energy bills significantly, the RGGI report did not evaluate the impact on residents’ average energy bills.

Carbon Pricing Success Story and Step Backwards

Overall, the RGGI program has provided us with a real world example that carbon pricing can be successfully implemented at a minimal cost, and that its benefits can exceed its costs several times over.

Unfortunately, the New Hampshire House of Representatives recently voted to withdraw the state from RGGI.  This despite the fact that New Hampshire used $3.1 million of their carbon allocation funds to reduce their state deficit, and invested another $24.4 million in energy efficency programs.  The state had used those funds to help businesses and schools become more energy efficient, weatherize low-income homes, provide energy efficiency job training for more than 170 workers, and so on.  New Hampshire Speaker William O’Brien justified the state’s RGGI withdrawal:

“Eliminating RGGI sends a clear signal to the business community that we are reversing the direction that the state is taking in terms of creating a regulatory environment that is pro-business. That’s critical in terms of sending a strong message that we are open for business and ready to work with employers to help grow our economy and create good, new jobs here.”

Apparently O’Brien considers it “pro-business” to eliminate a system which had created loans to help New Hampshire businesses lower energy expenses, and provided energy efficiency job training for hundreds of workers in the state.  Unfortunately, New Hampshire serves as a reminder that myths about the effects of carbon pricing tend to have more impact than reality.